
TM-2030 Technical Manual

12
3. Beyond beginners: Instructions for Operating levels L2, L3, L4. To
change: see Table 2, program P7.
Level L2 has all the functions of L1, but also allows access to some history information (see below) intended to help technicians
in analyzing systems to see that they are operating properly. Section 4 has a brief description. Section 6.3 has more details.
Level L3 and L4 have all functions of L2, and also adds additional programming functions summarized in Table 3 and detailed
in section 2.3 and 6.4. Also, Level L3 and L4 allow you to observe the “filtered values” of “Volts B1” or “Amps” (which are
extremely sluggish versions of these items) by pushing and holding the RESET button while viewing “VoltsB1” or
“Amps”. The meaning of the filtered values is described in section 6.2, step 5.
The difference between L3 and L4 is that the L4 level raises the requirement for a "charged" battery--beyond the usual
volts/amps requirement.(see Section 6.2 of these instructions). The additional requirement is that the battery must meet the
"float" requirement. defined for the SC-2030 charger described in “SC-2030 Solar Charge Controller User’s Manual”, section
6.5 Primarily useful with the SC-2030 charger. Not recommended unless you understand the “float” requirement.
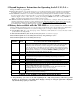
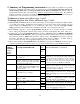
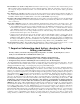
4. History data available with the TM-2030. Table 1 below summarizes the 36 items of history
data. It is available at Operating Levels L2 , L3 or L4. It is being recorded at level 1, but is only accessible at L2 or higher. These
are useful for a technician to determine if your system is working properly, or to diagnose a battery system problem.
To view the History data: Go to page 16 (last page of these instructions) which describes how to access this data. A chart is
provided there for recording the data.
To understand what this History data can tell you about your system: See section 6.3 on page 9.
The items H2 through H6 refer to data during the last 5 battery “charge/discharge” cycles.*
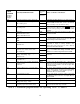
The items H7 through H9 refer to data during the last 5 days.
*A charge/discharge cycle refers to the time beginning from a fully charged battery, followed by partial
discharge (to less than 98%), and ending when charging it back up to “charged” again. Data is displayed
only when discharge again goes below 98%.
Display
Identifier
No. of
items
Summary History Description
(See section 6.3 for more detailed explanation)
H1
1
Cumulative lifetime battery (discharging) amp hours. Analogous to a car odometer, this
display shows how much wear has occurred on your batteries due to the repeated cycling of
your battery system. Every time you remove energy from your batteries this display
records the amp hours you are taking out, but it does NOT record the charging amp hours
when you charge. In this way it measures the wear caused by the discharging and charging
chemical activity on the battery over its lifetime. RESET to ZERO by pushing and
holding RESET for 4 seconds while displaying this data.
H2.1-2.5
5
For last 5 charge/discharge cycles*: Hours since the end of each cycle.
H3.1-3.5
5
For last 5 charge/discharge cycles*: Length of each cycle, hours.
H4.1-4.5
5
For last 5 charge/discharge cycles*: Charge efficiency measurement: Shows how much
more amp hours to charge compared to last discharge (in percentage) for entire last
discharge/charge cycle.
H5.1-5.5
5
For last 5 charge/discharge cycles*: Lowest % Full value during each cycle.
H6.1-6.5
5
For last 5 charge/discharge cycles*: Lowest battery voltage for each cycle.
H7.1-7.5
5
For last 5 days: Highest battery (B1) voltage attained for each day
H8.1-8.5
5
For last 5 days: If “highest voltage (H7) was less than “charged voltage setpoint” P1 then
this shows amps value while voltage was highest.
If “highest voltage (H7) exceeded “charged voltage setpoint” P1 then this shows the
lowest amps value during time that voltage was above setpoint.
Purpose: To show how close it got to voltage/amp charged setpoints.
H9.1-9.5
5
For last 5 days: for each day, shows charge percent that was replaced on that day,
compared to the previous lowest discharge.
TABLE 1. See section 6.3 for more discussion of these