User’s Manual 2.1 SERIES 7000 Models MODEL 7070, MODEL 7300 Berkeley Nucleonics Corporation 2955 Kerner Blvd., San Rafael, CA 94901 Phone: 415-453-9955, Fax: 415-453-9956, Email: info@berkeleynucleonics.com, Web: www.berkeleynucleonics.
WARRANTY Berkeley Nucleonics Corporation warrants all instruments, including component parts, to be free from defects in material and workmanship, under normal use and service for a period of one year. If repairs are required during the warranty period, contact the factory for component replacement or shipping instructions. Include the serial number of the instrument. This warranty is void if the unit is repaired or altered by others than those authorized by Berkeley Nucleonics Corporation.
Table of Contents 1 INTRODUCTION TO THE SERIES 7000 ....................................................................................................... 5 1.1 1.2 1.3 1.4 2 GENERAL FEATURES AND FUNCTIONS ................................................................................................................ 5 OPTIONS ...................................................................................................................................................... 6 FRONT PANEL OVERVIEW ..
5.5 6 USING THE GPIB INTERFACE .......................................................................................................................... 49 TYPE AND STRUCTURE OF COMMANDS ................................................................................................ 51 6.1 SERIES 7000 COMMANDS ........................................................................................................................... 51 6.1.1 IEEE common commands ........................................
1 Introduction to the SERIES 7000 Your SERIES 7000 kit contains the following items: • SERIES 7000 mainframe • Universal power adaptor (AC 100 – 240V) • Ethernet Cable • SERIES 7000 software CD It is strongly recommended to use the original power adaptor (as supplied with the device) to guarantee save and reliable operation of the SERIES 7000. 1.
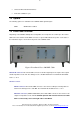
• Universal LAN and USB 2.0 interface • 24 months calibration cycle 1.2 Options The following options are available for the SERIES 7000 signal analyzer: GPIB: GPIB interface added 1.3 Front Panel Overview Depending on the SERIES 7000 product configuration, the front panel can contain up to five female SMA connectors and two female BNC connectors. A green LED indicates the power on/off status of the instrument. Figure 1 shows the front panels of the SERIES 7300..
TUNE connector This female BNC connector is the DC tune voltage output if a tuneable DUT or tuneable external reference is used. Power switch The power switch disconnects the instrument from the DC input completely. Caution: Do not apply a DC voltage or current to the individual ports of the DC Control, DC Power and RF Port. Applying a DC voltage or current may lead to the breakdown of this product. In particular, there is the risk of the capacitor remaining charged.
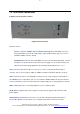
1.4 Rear Panel Connections In Figure 2 the rear panels is shown. Figure 2 Rear Panel View Channel 1 and 2: SUPPLY connector (SERIES 7000 and SERIES 7000 only) This female BNC connector is the programmable low-noise DC supply voltage output. Output voltage range is 0 V to +5 V, maximum available current is 80 mA. BASEBAND IN connector This female BNC connector is the baseband signal input.
This GPIB connector is used only for controlling the SERIES 7000-IS from an external controller. You cannot control other devices from the SERIES 7000 through this GPIB connector. Serial Number Plate The seal showing the serial number of the product. Berkeley Nucleonics Corporation 2955 Kerner Blvd., San Rafael, CA 94901 Phone: 415-453-9955, Fax: 415-453-9956, Email: info@berkeleynucleonics.com, Web: www.berkeleynucleonics.
2 Getting Started 2.1 System Requirements To ensure that your SERIES 7000 signal analyzer operates correctly with the remote control interface software, you must have a computer with at least the minimum system requirements to run one of the supported operating systems. Operating system Windows™ (2000 SP4, XP SP2, Vista, 7, 8) Minimum 1024 MB RAM Ethernet Port 10/100/1000M LAN or USB 2.0 Port 2.2 Unpacking the SERIES 7000 Remove the SERIES 7000 materials from the shipping containers.
configured properly, your network router will assign a dynamic IP number to the instrument. Your instrument is now ready to be controlled. 2.4.3 Connecting via LAN without DHCP Router (fallback or fixed IP) You can connect the instrument to your computer with the Ethernet cable without using a local area network with DHCP server. To work properly, the network controller (NIC) of your computer must be set to a fixed IP beginning with 169.254.xxx.xxx (excluding 169.254.1.0 and 169.254.254.
VISA now allows you to communicate as a controller to the SERIES 7000. 2.4.7 Using Berkeley Nucleonics Application Programming Interface (API) Please refer to the SERIES 7000 Programmer’s Manual to learn more about applying the API and programming examples. 2.4.8 Installing the SERIES 7000 Graphical User Interface Software Berkeley Nucleonics’s graphical user interface provides an intuitive control of the SERIES 7000.
2.4.10 Shutting Down the SERIES 7000 Press the Line on/off switch on the rear panel to power off. 2.4.11 Perform Firmware Upgrade A firmware upgrade of the SERIES 7000 can be done directly via the GUI. Make sure you are connected to the right device and have the correct firmware binary ready. Then go to Device Update Firmware and select the appropriate binary (tar.file) that you have received from Berkeley Nucleonics or downloaded from the Berkeley Nucleonics website.
3 Measurement using the Graphical User Interface (GUI) Berkeley Nucleonics’s graphical user interface provides an intuitive control of the SERIES 7000. It runs under any operating system supporting a Java Runtime Environment (JRE). Make sure the software is installed and the computer’s firewall configured as required. 3.1 Start the SERIES 7000 GUI Double-click the SERIES 7000 shortcut that will appear on your desktop after the software has been successfully installed.
3.2 Organization of the GUI The measurement window is organized as shown in Figure 4. The GUI is divided into three sections: a setup section on the top left, a plot configuration section on the top right and the actual measurement window on the bottom. Figure 4 GUI after start with devices detected (tab set to phase noise measurement) 3.2.1 Menu Section On the top, the drop-down menus File, Device, Plot, View, and Help are available and are described below: 3.2.1.
3.2.1.2 Device Device Connect automatically detects available SERIES 7000 devices though LAN or USB. If a connection is already established, it disconnects and opens the dialog as shown in Figure 3. Device Disconnect will terminate an existing connection to an SERIES 7000 instrument. Device Network Configuration allows reconfiguration of instrument local area network settings such as IP, subnet mask, or gateway. Any change will be effective after subsequent hardware reboot of the device.
Device Info provides product details of the instrument such as firmware version, instrument serial number and options installed as shown below. Berkeley Nucleonics Corporation 2955 Kerner Blvd., San Rafael, CA 94901 Phone: 415-453-9955, Fax: 415-453-9956, Email: info@berkeleynucleonics.com, Web: www.berkeleynucleonics.
3.2.1.3 Plot Plot Save, Load, & Print allows storing, loading, and printing of the plot window. Plots can be saved as PNG graphs or in SERIES 7000 internal mode (extension .Series 7000). They later can be loaded into the GUI. Data traces can be exported when saved as MATLAB™, MS EXCEL™ or CSV files (extension .csv). Plot Save Report auto-generates a pdf report including measurement trace, jitter data, Allan Dev plot and phase noise, spurious and marker data of the current measurement.
Figure 5 Spec Line Dialog Window Plot Settings opens the Plot Configuration Settings window as shown below. The plot configuration window allows customizing the plot window. Window title, marker lists, or trace data information such as residual FM or PM or integral Phase Noise can be displayed by checking the corresponding box. The appearance of the plot can be changed as well. In the middle section, the x and y axes can be scaled and renamed.
View Toggle Fullscreen allows toggling from and to full screen mode. Help Activate Extended Mode is intended for Berkeley Nucleonics engineers only and is used to calibrate the devices. Currently, customers can not activate this option. Berkeley Nucleonics Corporation 2955 Kerner Blvd., San Rafael, CA 94901 Phone: 415-453-9955, Fax: 415-453-9956, Email: info@berkeleynucleonics.com, Web: www.berkeleynucleonics.
Help Activate Logging logs status and error information from the GUI into a binary file. This file can then be sent as part of an error report to the Berkeley Nucleonics support email hotline. Help Check for GUI Update can be used to verify, if a newer version of the GUI is available for download from the Berkeley Nucleonics website. If a new version is available, it can be downloaded and installed directly. An unblocked internet access is required. Help About displays the GUI version information.
3.3 Measurement Tabs The following tabs (each corresponding to a particular measurement mode), are available: • Absolute Phase Noise, • Additive Phase Noise, Amplitude Noise (SERIES 7000 only), • Time Domain Analyzer (MODEL 7300 and MODEL 7070), • FFT Analyzer. Clicking on a tab will lead to the corresponding measurement setup. The following sections describe each measurement tab and how to configure it to successfully perform a measurement. 3.3.
3.4 Phase Noise Measurement Tab In this tab the DUT’s signal frequency and power is detected and the phase noise of the signal in the specified offset frequency range is analyzed. The measurement principle is based on the phase discriminator method in combination with a two channel cross-correlation. In general, two internal or external low noise reference sources are phase locked to the DUT signal. The frequency of the DUT is detected and a well characterized phase locked loop is closed.
A) Enable internal frequency counter and power meter (see Figure 6): If the auto checkbox is enabled, the counter and power meter are running and constantly updating the detected DUT frequency and power. Disabling allows manual entry of the DUT frequency. Internal counters and power detector is shut down. Per default, the auto-detection is on and once a valid signal is detected, the Measure button turns green and is enabled. B) Set frequency offset range using slider.
Figure 8 “More” Configuration Menu allows choosing reference source After clicking on the Measure button, the phase noise measurement is started. A couple of calibration steps are automatically performed and phase noise data is acquired from SERIES 7000. In the Measurement tab of the plot window the red trace shows the intermediate result as shown in Figure 8. Once the measurement is completed, the GUI returns into idle state.
correlation will only “smooth” the curve and remove trace noise, but will not further improve the phase noise value. Figure 9 Beat frequency as shown in the time tab within the plot window. Figure 10 Phase noise measurement completed. Noise floor (grey shade) is clearly below measured trace (red). Berkeley Nucleonics Corporation 2955 Kerner Blvd., San Rafael, CA 94901 Phone: 415-453-9955, Fax: 415-453-9956, Email: info@berkeleynucleonics.com, Web: www.berkeleynucleonics.
3.4.2 Using External References Configuring external references requires some additional parameter settings. A) Select between one channel or two channel measurement. B) Enter tuning slope (Hz/V) for each measurement channel used. Also enter the tuning voltage range for each reference. Using the “Meas” button, the tuning slope can also be measured automatically.
3.4.3 The Different Plot Window Tabs The plot window comprises of six tabs – Measurement – Time Domain – Data Table – Statistics – DUT Info – Measurement Status: The Measurement tab is the main tab to display frequency domain results like phase noise. The Time Domain tab is used to provide time domain measurement information during idle state (frequency and power detection, calibration) and during the measurement process (locking, and data acquisition).
Figure 11 The statistic tab provides additional information about the selected data trace The DUT Info tab constantly monitors the DUT CW frequency and power and also shows the tuning voltage of internal references. The values are updated approx. once per second in GUI idle state. The Measurement Status tab prints status and error messages that help user to verify the measurement process. 3.4.4 The Traces Window The Traces window is used to save and post-process acquired traces.
3.4.4.1 Add button Copies of the actual measurement trace (red trace) can be created and stored in the trace list by clicking on the “add” button. A copy of the active trace is stored in the list and by default named with “trace 1” with additional information such as DUT frequency, number of correlations and time and date of measurement. Each trace can be renamed by double-clicking on the corresponding trace name and typing in the new trace name. 3.4.4.
3.4.4.6 Delete traces Selected can be removed from the trace list by clicking on “Del” button. 3.4.4.7 Edit button Selected traces can be edited with “Edit” button that opens a window as show below. In this window, first choose to which traces the changes shall be applied: selected traces only, all stored traces, or all newly measured traces. The following functions can be applied: 1. Completely remove or show detected spurious signals that are above a user set threshold. 2.
If enabled, Spur and Marker Lists, the RMS Jitter, Residual phase error, the residual FM and the integral phase noise are displayed for the selected trace in small windows inside the measurement window and offset range as shown in Figure 12. Berkeley Nucleonics Corporation 2955 Kerner Blvd., San Rafael, CA 94901 Phone: 415-453-9955, Fax: 415-453-9956, Email: info@berkeleynucleonics.com, Web: www.berkeleynucleonics.
Figure 12 Plot window with Residual Noise and Marker Lists displayed 3.4.5 The Marker Window Multiple noise markers can be applied within the plot window. To add a new marker, press on the “New” button as shown below and move the mouse within the plot window. The marker will follow the active or selected trace. You can move markers to the desired trace by selecting the corresponding trace in the trace list. Berkeley Nucleonics Corporation 2955 Kerner Blvd.
Figure 13 Plot window with single trace selected and displayed and multiple markers set 3.4.5.1 New Markers New markers will appear in the list as soon as you click within the plot window. Once a marker is placed, it can be moved and the corresponding phase noise value is displayed in the window as shown in Figure 13. 3.4.5.2 Deleting Markers Markers can be removed by selecting them in the Markers list and clicking on the “Remove” button.
3.4.6.1 Print, Save and Copy Traces Phase noise plots can be printed by dragging mouse over plot window and pressing right mouse button (Figure 14) or through the Plot Print menu. Figure 14 Zoomed in trace 3.4.7 Saving Traces Traces can be exported and saved in various file formats through the Plot Save menu.
Besides programming of the external power supplies, there is a section called “Sampling configuration”. In this section, the oversampling factor can be set. This factor determines the FFT resolution of the measured trace. Per default the oversampling factor is two. The measurement time is directly affected by the oversampling factor. A higher oversampling factor gives better frequency resolution in the FFT and allows analyzing more details of spurious response.
3.5 General Measurement Settings 3.5.1 Number of data points per trace Per default, the number of points displayed in every trace is depending on the start and stop offset frequency. Data for SERIES 7000 / SERIES 7000 and MODEL 7070 /MODEL 7300 are shown in Table 1 and 2. Start / Stop 10 kHz 100 kHz 1 MHz 0.
The sampling time depends on the selected frequency offset range and the number of samples taken (oversampling factor, RBW). With increasing RBW the ability to distinguish spurious in frequency gets lost, but sampling time decreases. The number of measurement points per trace varies depending on the selected oversampling factor. The post-processing time is used to post-process and visualize the measured data.
3.6 AM Noise Measurement (SERIES 7000) This function measures the amplitude noise of the signal in the specified offset frequency range. Amplitude measurement does not require any reference sources and any few parameters must be set such as offset range and number of correlations. The amplitude noise measurement tab is shown in Figure 15. Figure 15 Amplitude noise tab Berkeley Nucleonics Corporation 2955 Kerner Blvd.
3.7 Additive Phase Noise Measurement The additive phase noise measurement tab provides single- or two channel cross-correlation additive phase noise measurements on non self-oscillating devices such as amplifiers in linear and non-linear operation or even frequency-translating devices such as mixers, frequency multipliers or dividers.
3.7.1 Measurement Procedure Before starting the calibration and measurement procedure, some parameters must be configured. Firstly, select single or two-channel measurement. Next, select what kind of external phase shifter is deployed. Any phase shifter is suitable that does not excessively contribute own noise such as digital or mechanically tuned models. Models that are tuned via analog voltage can be supported by the SERIES 7000 GUI.
1. Determine the phase detector constant. Start this step by pressing the “Measure” button in step1. Mechanically or digitally tuned phase shifters must be manually adjusted to provide at least 180 degrees phase shift to derive the phase detector constant. If already known for a given setup, the phase detector constant can be manually entered. In case “Analog Tune” is selected and voltage controlled phase shifters are used, this step is performed automatically by the instrument and can be omitted. 2.
Figure 18 Additive phase noise measurement tab after the measurement completed. Berkeley Nucleonics Corporation 2955 Kerner Blvd., San Rafael, CA 94901 Phone: 415-453-9955, Fax: 415-453-9956, Email: info@berkeleynucleonics.com, Web: www.berkeleynucleonics.
3.8 Transient Analyzer Measurement Berkeley Nucleonics Corporation 2955 Kerner Blvd., San Rafael, CA 94901 Phone: 415-453-9955, Fax: 415-453-9956, Email: info@berkeleynucleonics.com, Web: www.berkeleynucleonics.
3.9 FFT Analyzer Measurement This tab is used to measure noise on one or two channels of the FFT analyzer. Select the frequency range and the number of averages. Under “More” select either “Single Channel” or “Two channel cross-correlated” measurement. Press start button to run measurement. Figure 19 FFT Analyzer Mode Berkeley Nucleonics Corporation 2955 Kerner Blvd., San Rafael, CA 94901 Phone: 415-453-9955, Fax: 415-453-9956, Email: info@berkeleynucleonics.com, Web: www.berkeleynucleonics.
4 System Calibration (Firmware 1.0 and up) User calibration is a function to correct the frequency response using correction data set for phase noise, amplitude and baseband noise measurements. This chapter describes the correction method and how to set up the calibration procedure. User calibration procedure will be supported from firmware and remote client revision 1.0 Please contact support@Berkeley Nucleonics.com to check availability. Berkeley Nucleonics Corporation 2955 Kerner Blvd.
Berkeley Nucleonics Corporation 2955 Kerner Blvd., San Rafael, CA 94901 Phone: 415-453-9955, Fax: 415-453-9956, Email: info@berkeleynucleonics.com, Web: www.berkeleynucleonics.
5 Remote Programming the SERIES 7000 The SERIES 7000 can be remote controlled via three independent but functionally equivalent interfaces: USBTMC, LAN, and (optionally) GPIB. 5.1 Access via LAN The signal analyzer can be remotely programmed via a 10/100/1000Base-T LAN interface and LANconnected computer using one of several LAN interface protocols. The LAN allows instruments to be connected together and controlled by a LAN- based computer.
VISA is an IO library used to develop IO applications and instrument drivers that comply with industry standards. It is recommended that the VISA library be used for programming the signal source analyzer. The NI-VISA and Agilent VISA libraries are similar implementations of VISA and have the same commands, syntax, and functions. 5.3 Using the USB-TMC Interface with VISA The USB (Universal Serial Bus) remote control system provides device control via USB, which is equivalent to control via LAN or GPIB.
controller connected to the GPIB connector, you need to set the talker/listener GPIB address of the SERIES 7000. Please see the SERIES 7000 Programmer’s Manual for further details. Berkeley Nucleonics Corporation 2955 Kerner Blvd., San Rafael, CA 94901 Phone: 415-453-9955, Fax: 415-453-9956, Email: info@berkeleynucleonics.com, Web: www.berkeleynucleonics.
6 Type and Structure of Commands The SCPI commands available for the SERIES 7000 are classified into 2 groups as follows. 6.1 SERIES 7000 commands Commands specific to the SERIES 7000. They cover all measurement functions that the SERIES 7000 has and some general-purpose functions. The commands in this group are arranged in a hierarchical structure called the command tree.
7 Maintenance and Warranty Information 7.1 Adjustments and Calibration To maintain optimum measurement performance, the SERIES 7000 should be calibrated every 24 months. It is recommended that the SERIES 7000 be returned to Berkeley Nucleonics or to an authorized calibration facility. For more information please contact our Customer Service Department at support@Berkeley Nucleonics.com or through our website. 7.2 Repair The instrument contains no user-serviceable parts.
The SERIES 7000 also meets the intent of the Low Voltage Directive and have been designed to meet the IEC 61010-1:2001 (safety requirements for electrical equipment, control, and laboratory use) standard. 7.5 Warranty Information All Berkeley Nucleonics instruments are warranted against defects in material and workmanship for a period of two years from the date of shipment.
Berkeley Nucleonics Corporation 2955 Kerner Blvd., San Rafael, CA 94901 Phone: 415-453-9955, Fax: 415-453-9956, Email: info@berkeleynucleonics.com, Web: www.berkeleynucleonics.