
User's Manual

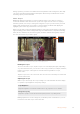


The vectorscope displays the overall range of
color hue and saturation within the image
TIP When monitoring a video signal that contains skin tone, you will want to keep
your warm color saturation along a line at approximately 10 o’clock on the vectorscope.
This is known as the “fleshtone line” and is based on the color of blood beneath the
skin’s surface. The fleshtone line is therefore applicable to all skin pigmentations and
is the best way to ensure the skin tones look natural.
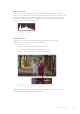
Zooming into the Vectorscope Graph
The ‘zoom’ feature on the vectorscope display lets you magnify the graph so you can get a
closer look at the color information in your image. This is helpful when monitoring images that
are desaturated, as they can typically appear as a small cluster of data around the center of
the chart.
To zoom into the vectorscope display:
1 Double tap the display for 2x magnification.
2 Double tap again for 4x magnification.
3 Double tap a third time to return to standard viewing size.
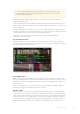
Histogram
The histogram shows the distribution of the luminance or the black to white information along a
horizontal scale, and lets you monitor how close the detail is to being clipped in the blacks or
whites of the video. The histogram also lets you see the effects of gamma changes in the video.
The left edge of the histogram displays shadows, or blacks, and the far right displays highlights,
or whites. If monitoring the image from a camera, when you close or open the lens aperture
you will notice the information in the histogram moves to the left or right accordingly. You can
use this to check ‘clipping’ in your image shadows and highlights, and also for a quick overview
of the amount of detail visible in the tonal ranges. For example, a tall and broad range of
information around the middle section of the histogram corresponds to good exposure for
details in the midtones of your image.
26Changing Settings