
User's Manual


RGB Parade
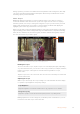
The RGB parade shows separate waveforms displaying the luminance of each red, green and
blue color channel. By showing a comparison of each channel, the parade scope makes it
possible to monitor the levels of each channel, plus spot color casts by comparing the
highlights, midtones and shadows between each channel. For example, if the shadows are
higher in the blue channel, your blacks will have a shade of blue to them.
Having the ability to see how the differences between all the tonal ranges compare within each
channel gives you an extremely detailed overview of color in your image. You can immediately
spot white balance issues and color casts, and because the parade scope shows a waveform
for each channel, you can also see if one specific color channel is clipping, which you may not
see if you are looking at a single combined waveform.
The three separate RGB waveforms follow the same principles displayed in the waveform
scope, with the top, middle and bottom positions representing the highlights, mid tones and
shadows along the horizontal axis of the video image.
The RGB parade displays separate waveforms displaying
theluminance of the red, green and blue channels
Vectorscope
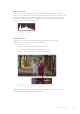
The vectorscope measures the overall range of color hue and saturation within an image.
Blackmagic Video Assist has a traditional vectorscope, emulating a trace drawn graph,
with 100 percent color bar saturation targets positioned at the graticule markers surrounding
the graph.
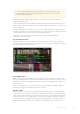
Heavily saturated colors in the frame stretch those parts of the graph closer to the edge, while
less saturated colors remain closer to the center of the vectorscope, which represents
0 saturation. By judging how many parts of the vectorscope graph branch out at different
angles, you can see how many hues there are in the image, with the specific angle of each part
of the graph showing you which hues they are.
Additionally, by judging how well centered the middle of the vectorscope graph is relative to the
center of the vectorscope, you can get an idea of whether there is a color imbalance in the
image. For example, if the vectorscope graph is off centered, the direction in which it leans lets
you know that there is a color cast or tint in your image.
While color balance can be monitored on both the RGB parade display and vectorscope
display, color balance issues will often be easier to see in the vectorscope display.
25Changing Settings