
User's Manual

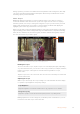


Tapping the ‘preview icon’ displays the scopes full screen, while displaying the video
image in the top right corner. This provides another option to view both scopes and the
video image at the same time, but lets you study the scopes in greater detail. You can
also move the preview to a different area by dragging it to a new location.
Tapping the preview icon will display the scopes full screen with
the video image in the top right corner of the screen
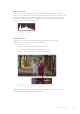
Waveform
The waveform display provides a digitally encoded waveform similar to traditional luminance
waveform monitors, which is used to monitor the luma or brightness levels of your video signal.
The bottom of the graph indicates the black level, or shadows, of the image, while the top of the
graph indicates the white level, or highlights. The range between the top and bottom of the
graph indicates the overall contrast ratio of the image you’re evaluating. Depending on your
footage, your waveform will look different. If you are monitoring video which is high contrast,
you might not see any values in the mid grays.
For perfect video levels without clipping, you will want to make sure the blacks in your
waveform do not drop below 0% and the whites do not exceed 100%. If the levels exceed these
boundaries, the video image will be clipping and you will see the results as lost detail in the
shadows and highlights of your image.
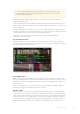
The waveform monitor is a graphical representation of the image, showing luma values
corresponding to the same horizontal position within the video image. For example, if filming an
outdoor scene where the left side of your sky is overexposed, you will see the left side of the
waveform graph above 100%.
The waveform display showing luminance values
24Changing Settings