
Troubleshooting guide

257
17: Testing applications
13. In the profile pane, click Refresh. This action retrieves all accumulated profile data from the JVM. This action
does not clear Profiler data, so running an application again adds to the data.
• Use profile views to view information about the section of code that you just ran.
14. Click Save to save the contents of the profile pane to a comma separated values (.csv) file.
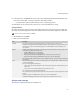
View profile data
The profile pane has three views. Each view contains details about an item of execution (such as a method), the
percentage of time that the application ran the item, and the number of times that the appplication ran the item.
1. On the View menu, click Profile.
2. Click one of the following tabs:
Analyze code coverage
The Coverage tools display a summary of code that has run.
Note: To view all accumulated data, click Refresh.
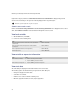
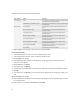
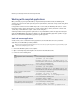
View Description
Summary The Summary view displays general statistics about the system and the garbage collection process.
It displays the percentage of time that the JVM spends idle, executing code, and performing quick and full garbage
collection processes. The Percent column displays the percent of total JVM running time, including idle and
collection times.
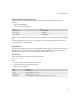
Methods The Methods view displays a list of modules, sorted either by the information that you are profiling or by the number
of times that the application executed each item.
• Expand the All item to see a list of all methods.
• Expand a specific module to see only its methods.
• Right-click a method, and then click Profile Source to view source lines in the Source view.
• Right-click a method, and then click Show Source to view source code in the Edit window.
In this view, the Percent column displays the percentage of JVM execution time only, not including idle and garbage
collection times.
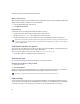
Source The Source view displays the source lines of a single method. You can navigate through the methods that call, and
are called by, that method.
The Source view displays the following items:
• a list of callers to the method, including the number of times that they make the call and the total time spent
on these calls
• a list of source lines for the method and the total time spent on these lines
You can expand a source line to show individual bytecode.
You can further expand any bytecode that corresponds to a method invocation to show the target(s) of the method
invasion.
Right-click a line and select Show Source to view the source code in the Edit window.
Click Back and Forward to follow the history of methods that you have visited in the Source view.