
Troubleshooting guide

255
17: Testing applications
View the source of a logging message
> In the event log pane, on the Build tab, double-click the error message.
View classes
Select a subset of classes
Type the Class Name Prefix and press ENTER. For example, type java.lang. In the classes pane, classes that start
with the string typed in the Class Name Prefix field appear.
1. In the classes pane, right-click a class.
2. Perform one of the following tasks:
View the methods in a class
The methods pane displays all methods in a class. In the classes pane, double-click a class. The methods pane
updates to display all methods in the selected class.
Optimize source code using the BlackBerry IDE profiler tool
To optimize your code, use the profiler tool of the BlackBerry® Integrated Development Environment. The profiler
tool displays the percentage of time spent in each code area to the current point of execution.
Set profile options
1. In the profile pane, click Options.
2. On the General tab, set the following options:
Task Step
> Display the source code that implements the selected class. Click Source code.
> Set the BlackBerry® Integrated Development Environment to trigger a breakpoint when the
code throws an object of the selected class.
Click Break when exception thrown.
> Set the BlackBerry IDE to trigger a breakpoint when an object of the selected class is
instantiated.
Click Break on new object.
Note: To improve the quality of results when you run the profiler tool, exit other Microsoft® Windows® applications.
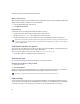
Drop-down list Option Description
Method attribution Cumulative The profiler tool calculates the time spent executing bytecode in
a method and all methods that the method invokes.
In method only The profiler tool calculates the time spent executing bytecode in
that method only. The timer stops when a call is made to another
method.