
Troubleshooting guide

253
17: Testing applications
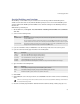
Evaluate (watch) Java expressions
The Watch pane lets you specify variables and expressions to watch continuously while debugging your
application.
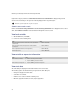
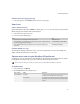
1. Right-click the Watch pane.
2. Perform one of the following tasks:
See "View threads" on page 253 for more information about viewing the format of threads appearing in the Watch
pane.
See "View the data members of a process" on page 254 for more information about viewing the format of the
processes that appear in the Watch pane.
View threads
The threads pane displays all threads running on the BlackBerry® device. The most recent thread appears yellow.
To view the source code in the text edit pane, double-click a thread. The BlackBerry Integrated Development
Environment marks the line in the source code that starts the thread with an arrow.
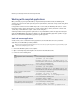
Thread format
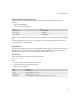
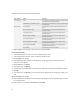
The Thread column displays each thread in the following format:
name(pid): status
where:
• name is the name of the process that starts the thread
• pid is the ID of the process that starts the thread
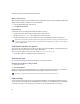
• status is one of the following:
Task Steps
Set a new watch. >Click Add Watch.
Remove a watch. >Click Delete.
Remove all watches. >Click Delete All.
Status Description
running thread is running
sleeping thread is calling Thread.sleep()
waiting for notify thread is calling Object.wait()
acquiring lock thread is executing a “synchronized” statement and is being forced to wait