
Troubleshooting guide


250
BlackBerry Java Development Environment Development Guide
You can now run your applications on the BlackBerry device and use the BlackBerry Integrated Development
Environment debugging tools to test and optimize your application.
Step through lines of code in an application
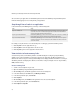
In the main window, on the Debug menu, perform any of the following tasks:
For example, to step into function “f” in the following line of code f(g(x)), perform the following actions:
1. Click Step Into to run the application into “g.”
2. Click Step Out to return the application to the line of code.
3. Click Step Into again to run the application into function “f.”
View statistics to locate memory leaks
To locate memory leaks, use the Memory Statistics tool with the Objects tool. Begin by using the Memory
Statistics tool to retrieve information on the memory usage of your application. The Memory Statistics tool
identifies the number of objects in memory, while the Objects tool displays detailed information for each object.
The Memory Statistics tool displays the statistics on the number of objects and bytes in use for object handles,
RAM, and flash memory.
Locate a memory leak
1. Set two or more breakpoints in your code.
2. Open the BlackBerry Integrated Development Environment.
3. On the Debug menu, click Go. The application runs to the first breakpoint.
4. In the main window, on the View menu, click Memory Statistics.
5. In the memory statistics pane, click Refresh.
6. Click Snapshot.
7. On the Debug menu, click Continue. The application runs to the second breakpoint.
8. In the memory statistics pane, click the Refresh tab.
9. Click Compare to Snapshot.
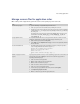
Task Steps
Step over a method call. The BlackBerry® Integrated Development Environment debugger moves to the next line of
code. If the source line is a method call, the application runs the entire method without
stepping through the individual method instructions.
Step through method instructions. The BlackBerry IDE debugger moves to the next line of code. If the source line is a method call,
the application stops just before running the first statement of the method.
Step out of method instructions. The BlackBerry IDE debugger moves to the next line of code. If the source line is part of a
method, the application runs the remaining lines of the method and returns control to the
caller of the method.