
Troubleshooting guide


247
17: Testing applications
One debugging method is to start by setting only a few breakpoints at critical sections of your code, and then
gradually set breakpoints at shorter intervals. To identify the problem, after the application pauses at a
breakpoint, use debugging tools to view various application processes and statistics.
Debug an application in the BlackBerry IDE
1. Copy the application .cod, .csl, .cso, .debug, and .jar files into the BlackBerry® device simulator root directory:
C:\Program Files\Research In Motion\BlackBerry JDE 4.2.0\simulator
2. Open the BlackBerry Integrated Development Environment.
3. Add and set up a workspace for your application.
4. Add your application to the workspace.
5. Start any simulators that your application requires.
Without access to a BlackBerry Enterprise Server, you need the BlackBerry MDS™ Simulator to simulate
browser traffic, HTTP/TCP connections to third-party applications, and push functionality. To debug
applications that send and receive messages between a BlackBerry device simulator and a computer email
application, use the BlackBerry email server simulator. See the
Simulator Guide for more information.
6. On the Debug menu, click Go. The BlackBerry IDE builds all active projects in the workspace and loads the
applications in the BlackBerry device simulator.
7. In the BlackBerry device simulator window, test the relevant sections of code.
8. On the Debug menu, click Break Now.
9. To resume debugging your application, on the Debug menu, click Continue.
10. To stop debugging your application, in the BlackBerry device simulator, on the File menu, click Quit.
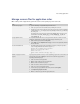
Remove a breakpoint. 1. Open the source file.
2. In the Edit window, click the line of code that contains the breakpoint you want to remove.
3. On the Debug menu, click Breakpoint > Delete Breakpoint at Cursor.
Remove all breakpoints. 1. On the View menu, click Breakpoints.
2. In the breakpoints pane, click Delete All.
Task Steps