YOU'RE HEARD, LOUD AND CLEAR. Instruction Manual Vari-Notch® Cavity Filter 6 5/8” and 10” Diameter Manual Part Number 7-9144 8625 Industrial Parkway, Angola, NY 14006 Tel: 716-549-4700 Fax: 716-549-4772 sales@birdrf.com www.bird-technologies.
Warranty This warranty applies for one year from shipping date. TX RX Systems Inc. warrants its products to be free from defect in material and workmanship at the time of shipment. Our obligation under warranty is limited to replacement or repair, at our option, of any such products that shall have been defective at the time of manufacture. TX RX Systems Inc. reserves the right to replace with merchandise of equal performance although not identical in every way to that originally sold. TX RX Systems Inc.
Manual Part Number 7-9144 Copyright © 1996 TX RX Systems, Inc. First Printing: July 1996 Version Number Version Date 1 07/22/96 Symbols Commonly Used WARNING ESD Elecrostatic Discharge CAUTION or ATTENTION Hot Surface High Voltage Electrical Shock Hazard Use Safety Glasses Bird Technologies Group NOTE Important Information TX RX Systems Inc.
dBm 200 KHZ/DIV 300 KHZ/RES 98.00 MHZ 10 0 INSERTION LOSS -10 PASSBAND -20 -30 -40 REJECTION NOTCH -50 -60 -70 40 dB ATT 10 MSEC GEN 0 dBM Figure 1: Spectrum Analyzer / Tracking Generator display of the highpass Vari-Notch filter. Response curve shown for model # 15-29-01 (88 - 108 MHz) GENERAL DESCRIPTION The Vari-Notch® cavity filter is designed to pass a relatively narrow band of frequencies (passband) while simultaneously rejecting a wide band of frequencies (rejection notch).
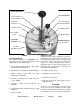
Coarse Tuning Rod Fine Tuning Rod Coarse Tuning Lock 10-32 Cap Screw Loop Plate Hole Cover Fine Tuning Lock Knurled Thumb Nut Cavity Resonator Calibration Index Input / Output Ports Calibration Mark Loop Plate Assembly Variable Capacitor Access Barrel Loop Plate Hold Down Screws Figure 2: The Vari-Notch filter. 1. IFR A-7550 Spectrum Analyzer with optional Tracking Generator installed. Tuning Procedure Tuning of the filter requires adjustment of the passband and the rejection notch.
best when the reflected energy is lowest, therefore the return loss response will be used to set the passband. The passband can be checked and adjusted using the following procedure. Checking the passband 1. A zero reference for return loss must be established at the IFR A-7550 prior to checking the passband frequency, this is done by connecting the return loss bridge to the analyzer / generator as shown in figure 3. dBm 40 200 98.00 300 KHZ / DIV MHZ KHZ RES 4.
dBm 40 200 98.00 300 KHZ / DIV MHZ KHZ RES 30 20 10 pressure weld that maintains excellent conductivity. The pressure weld develops over time and must be broken in order for the main tuning rod to move. This is easily accomplished by gently tapping the tuning rod with a plastic screwdriver handle or small hammer so it moves into the cavity. The pressure weld will be broken with no damage to the cavity.
dB dBm 10 200 97.00 300 KHZ / DIV MHZ KHZ RES 8 200 98.00 300 KHZ / DIV MHZ KHZ RES 6 0 4 -10 2 -20 0 -30 -40 -2 -50 -4 -60 -6 -8 -70 40 dB ATT GEN 0 dBM 10 MSEC GENERATE ANALYZER 40 dB ATT GEN 0 dBM 10 MSEC GENERATE ANALYZER FEMALE UNION Used to determine 0 dB reference VARI-NOTCH FILTER 0 0 5 5 10 10 15 15 20 20 VARI-NOTCH FILTER Figure 6: Checking insertion loss. Figure 5: Checking the rejection notch. equal to an insertion loss of 0.6 dB.
main menu item and choosing the "Store" command. 5. Next select the "Display" main menu item and choose the "Reference" command. This will cause the stored value to be displayed at the center of the screen as the 0 dB reference value. 6. Connect the generator output and analyzer input to the input/output ports of the loop plate and the amount of insertion loss offered by the Vari-Notch filter will be displayed on the IFR A-7550's screen, refer to figure 6.
Isolation Curves for Transmitter/Receiver The curves shown below for use with filters, duplexers, and multicouplers, indicate the amount of isolation or attenuation required between a typical 100 watt transmitter and its associated receiver at the TX (carrier suppression) and RX (noise suppression) frequency which will result in no more than a 1 dB degradation of the 12 dB SINAD sensitivity.
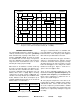
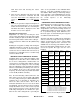
Power Ratio and Voltage Ratio to Decibel Conversion Chart Loss or Gain +9.1 dB -9.1 dB Power Ratio 8.128 0.123 Voltage Ratio 2.851 0.351 - dB + Voltage Ratio 1 0.989 0.977 0.966 0.955 0.944 0.933 0.923 0.912 0.902 0.891 0.881 0.871 0.861 0.851 0.841 0.832 0.822 0.813 0.804 0.794 0.785 0.776 0.767 0.759 0.75 0.741 0.733 0.724 0.716 0.708 0.7 0.692 0.684 0.676 0.668 0.661 0.653 0.646 0.638 0.631 0.624 0.617 0.61 0.603 0.596 0.589 0.582 0.575 0.569 Power Ratio 1 0.977 0.955 0.933 0.912 0.891 0.871 0.851 0.
POWER IN/OUT VS INSERTION LOSS The graph below offers a convenient means of determining the insertion loss of filters, duplexers, multicouplers and related products. The graph on the back page will allow you to quickly determine VSWR. It should be remembered that the field accuracy of wattmeter readings is subject to considerable variance due to RF connector VSWR and basic wattmeter accuracy, particularly at low end scale readings.
POWER FWD./REV. VS VSWR 500 400 V S W R 300 200 100 1.1:1 FORWARD POWER (Watts) 50 40 1.15:1 30 1.2:1 20 1.25:1 1.3:1 10 1.4:1 5.0 4.0 1.5:1 3.0 1.6:1 1.8:1 2.0 2.0:1 1.0 2.5:1 3.0:1 0.5 40 20 10 8.0 6.0 4.0 2.0 1.0 0.8 0.6 0.4 0.2 REFLECTED POWER (Watts) FOR OTHER POWER LEVELS MULTIPLY BOTH SCALES BY THE SAME MULTIPLIER Bird Technologies Group TX RX Systems Inc.
Return Loss vs. VSWR Watts to dBm Return Loss VSWR Watts dBm 30 1.06 300 54.8 25 1.11 250 54.0 20 1.20 200 53.0 19 1.25 150 51.8 18 1.28 100 50.0 17 1.33 75 48.8 16 1.37 50 47.0 15 1.43 25 44.0 14 1.50 20 43.0 13 1.57 15 41.8 12 1.67 10 40.0 11 1.78 5 37.0 10 1.92 4 36.0 9 2.10 3 34.8 2 33.0 1 30.
8625 Industrial Parkway, Angola, NY 14006 Tel: 716-549-4700 Fax: 716-549-4772 sales@birdrf.com www.bird-technologies.