
User Manual

| 15SsoAdvanced
™
Universal Probes Supermix Instruction Manual | 15
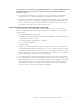
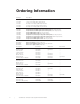
Common PCR Inhibitors*
From the Sample From the Isolation Method
Melanin EtOH >1% v/v
Polysaccharides Proteinase K
Polyphenolics DMSO >5%
Hemoglobin EDTA >50 mM
Chlorophyll SDS >0.01% w/v
Heparin Sodium Acetate >5 mM
Humic acid Mercaptoethanol
Hematin Guanidinium
Phenol >0.2% v/v
DTT >1 mM
* Not an inclusive list.
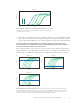
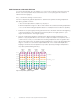
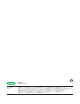
3. If the most concentrated sample in the dilution series is showing compression, as seen in
Figure 10, where the tenfold dilution series ∆Cq value is < 3.3 compared to the more diluted
points, then PCR inhibitors are most likely present in the sample. However, compression
may also be due to an overloaded amount of template, error in the dilution series, or
pipetting error.
a. Re-purify the sample(s) using a different isolation method, or post-isolation column cleanup
b. Remove the highest dilution point
c. Increase the annealing/extension time
Fig. 10. Presence of PCR inhibition at the
highest dilution point, as indicated by
delayed amplification.
0
0
10
20
30 40
10
2
10
3
10
4
Amplification
Cycles
RFU
∆ Cq 2
∆ Cq 3.3