SsoAdvanced™ Universal Probes Supermix Instruction Manual For use with probe-based real-time PCR applications on all real-time PCR instruments Catalog # 172-5280 172-5281 172-5282 172-5284 172-5285
Bio-Rad Technical Support For help and technical advice, please contact the Bio-Rad Technical Support department. In the United States, the Technical Support department is open Monday–Friday, 5:00 AM–5:00 PM, Pacific time. http://www.bio-rad.
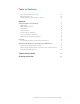
Table of Contents Sso7d Fusion Enzyme Technology iii Educational Resources iv Reagent Evaluation and Comparison Tutorials iv Protocol 1 Sample Preparation Considerations 1 RNA Samples 1 RNA Integrity and Purity 1 DNA Samples 2 Plasmid Samples 2 Assay Design Considerations 3 Some Key Design Considerations 3 Multiplex Assays Design Considerations 4 Procedure 6 Reaction Mix Preparation and Thermal Cycling Protocol Real-Time PCR Validation for Gene Expression Experiments Determining th
SsoAdvanced™ Universal Probes Supermix Catalog # Supermix Volume Kit Size 172-5280 2 ml (2 x 1 ml vials) 200 x 20 μl reactions 172-5281 5 ml (5 x 1 ml vials) 500 x 20 μl reactions 172-5282 10 ml (10 x 1 ml vials) 1,000 x 20 μl reactions 172-5284 25 ml (5 x 5 ml vials) 2,500 x 20 μl reactions 172-5285 50 ml (10 x 5 ml vials) 5,000 x 20 µl reactions Shipping and Storage The SsoAdvanced universal probes supermix is shipped on dry ice.
Sso7d Fusion Enzyme Technology Bio-Rad introduced our next generation of real-time PCR supermixes using our patented Sso7d fusion protein technology, delivering a reagent that provides effective performance in a wide range of qPCR applications. The dsDNA-binding protein, Sso7d, stabilizes the polymerase-template complex, increases processivity, and provides greater speed and reduced reaction times compared to conventional DNA polymerases, without affecting PCR sensitivity, efficiency, or reproducibility.
Educational Resources Understanding the Basics To learn more about similarities and differences between PCR and real-time PCR, understand how SYBR® Green and probe-based chemistries function, and see how data are collected and interpreted, please view our interactive tutorial Understanding Real-Time PCR.
Protocol This manual is intended for use with probe-based assays on all real-time PCR systems using a broad range of cycling conditions, template and primer input concentrations, and fast or standard run times.
DNA Samples ■■ ■■ I solate DNA using the appropriate method for the given sample type (for example, column purification for cell lines, phenol/chloroform or column purification for tissue samples) Store the DNA in an appropriate solution – 0.1 mM EDTA (in DEPC-treated ultrapure water) – TE Buffer (10 mM Tris-HCl, 1 mM EDTA, pH 7.
Assay Design Considerations When using custom designed assays, several important considerations should be noted: ■■ ■■ ■■ ■■ ■■ ■■ ■■ Biological significance (correct isoform/splice variant chosen) Sequence quality and secondary structure — evaluate using web-based tools to understand the complexity of the structure, as it can impact the reaction performance Sequence length — use the entire gene sequence, or a specific region of interest, to optimally design an assay Sequence masking — use web-based
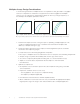
Multiplex Assays Design Considerations To ensure data generated in a multiplex reaction are equivalent to data generated in a singleplex reaction, it is imperative to evaluate the assay performance in both singleplex and multiplex reactions. It is also important to understand the expression level of your target sequences, as this will impact the multiplex optimization method. A B C Fig. 1. Graphs show the three modes for expression in a duplex reaction.
5. Reduce the primer concentration of the higher expressing target. ■■ educing the concentration, often times to 100–150 nM final, enables the lower expressing R target to amplify sufficiently. Use a primer matrix to determine the optimal concentration, at which the chosen concentration would yield no shift in Cq values while exhibiting the lowest flwescence signal 6. Reduce the primer concentration of both or all targets when the expression levels are unknown or vary from sample to sample.
Tips to Get Started ■■ ■■ ■■ Always evaluate the performance of the supermix following the recommended reaction and cycling conditions prior to modification Be sure to set the activation time to 30 sec for cDNA and 2–3 min for genomic DNA The 2x supermix has been optimized for 20 µl reactions in 96-well plates and 10 µl reactions in 384-well plates Procedure Reaction Mix Preparation and Thermal Cycling Protocol 1.
Table 2. Thermal cycling protocol.
2. From your experiment, randomly select a few samples from each group (for example, treatments, time courses, sources) ensuring that you evaluate all variable sample groups. 3. Isolate the RNA and DNase-treat using the same protocol for all samples. Quantify and normalize the RNA to the same concentration. 4. Perform a reverse transcription reaction for each sample using the same kit, volume, and concentration.
Determining the Dynamic Range of the Reverse Transcription Reaction An optimal reverse transcription reaction is expected to generate a true representation of the RNA converted into cDNA. However, it is imperative to determine the dynamic range of the reaction to ensure that the initial RNA loaded does not fall outside the dynamic range. If it does, then the downstream real-time PCR data may be invalid. To validate the dynamic range, perform the following : 1.
4. Dilute the cDNA as needed to perform real-time PCR reactions using a minimum of two genes — reference and low expressing. However, it is recommended to evaluate four genes — reference, low, medium, and high expressing. 5. Prepare the real-time PCR plate (Figure 5) and cycle according to the recommended protocol. Reference gene Low expressor Medium expressor High expressor Fig. 5. A recommended plate layout. 6. Evaluate the data.
B A 1 pg 10 pg 100 pg 1 ng 1 pg 10 pg 100 pg 1 ng 10 ng 100 ng 1 µg Cq Cq 10 ng 100 ng 1 µg Initial RNA Initial RNA C D 1 pg 1 pg 10 pg 100 pg 1 ng Cq Cq 10 ng 100 ng 1 µg 10 pg 100 pg 1 ng Initial RNA 10 ng 100 ng 1 µg Initial RNA E 1 pg Cq 10 pg 100 pg 1 ng 10 ng 100 ng 1 µg Initial RNA Fig. 6. The blue standard curve represents the target gene and the green standard curve represents the reference gene.
1. A serial dilution of the cDNA, gDNA, or plasmid template is required to prepare the standard curve. Ensure an adequate supply of template and an adequate volume are available to evaluate all the assays used in the experiment. Serial dilution of the template 1 1:10 1:100 1:1,000 1:10,000 1:100,000 1:1,000,000 Fig. 7. Tenfold serial dilution covering 6 logs of dynamic range is prepared using a starting template of your choice based on target expression levels. 2.
Tips for Success ■■ ■■ ■■ ipet a minimum of 5 µl for each sample. This ensures greater precision and a smaller standard P deviation for technical replicates. If the samples are too concentrated, simply dilute accordingly. Use a calibrated pipet of the appropriate volume range and never plunge the tip more than several millimeters below the surface of the sample.
Troubleshooting Guide Poor Nucleic Acid Yields Review Tables 3 and 4 to determine if you are within an acceptable range of nucleic acid yield. If your yields of RNA are considerably less than is typical for your sample type, reevaluate your isolation method. For reference, typical yields from some mammalian tissues are listed in tables 3 and 4. Table 3. RNA yields. Total RNA per Cell Total DNA per Cell 5–30 pg Varies by genome Table 4. RNA yields per mg of tissue.
Common PCR Inhibitors* From the Sample From the Isolation Method Melanin Polysaccharides Polyphenolics Hemoglobin Chlorophyll Heparin Humic acid Hematin EtOH >1% v/v Proteinase K DMSO >5% EDTA >50 mM SDS >0.01% w/v Sodium Acetate >5 mM Mercaptoethanol Guanidinium Phenol >0.2% v/v DTT >1 mM * Not an inclusive list. 3. If the most concentrated sample in the dilution series is showing compression, as seen in Figure 10, where the tenfold dilution series ∆Cq value is < 3.
Low Template Input, Low Expression, High Cq Values If your Cq values are higher than expected or you are concerned about Cq values >30, consider the following corrective actions: 1. Confirm the expected expression level, if known, to ensure that the target of interest is present in your given sample. Additionally, consider higher input concentrations of sample for low expressing targets.
Amplification 16 14 (RFU)(10 ^3) 12 10 8 Cq 6 Cq 8 6 4 2 0 10 0 30 20 Cycles 40 Fig. 12. Baseline setting is best completed in the linear view. In this example, the amplification starts around cycle 8; therefore, setting the end baseline two cycles prior at cycle 6 is best. 2. Either remove this data point or dilute your sample so that it does not show amplification earlier than cycle 15. This ensures that the software’s algorithm has enough background to subtract from the signal.
PCR Performance Not 100% Efficient If you have already ruled out your samples as a source for poor efficiency, then the assay may be the cause of the problem. Please review the section on assay design in this manual for further information (page 3). Also, consider the following corrective action: Perform a temperature gradient experiment to determine the optimal annealing temperature. Set up the gradient as follows: a. Use several representative samples in your project. b.
If you suspect the standard curve and dilution points are not within the MIQE guidelines of 90–110% PCR efficiency with an R2 of 0.99 or greater, consider the following corrective actions: 1. Ensure that the standard curve covers at least 5–6 logs of dynamic range. When the standard curve is too small, the variability of the true efficiency greatly increases. 2. If the R2 is <0.98, review the standard curve data points for outliers. Remove any outliers where the ∆Cq is >0.5 for the group.
If your no-RT control wells indicate amplification, you need to determine the amount of gDNA contamination present in your cDNA sample(s) to understand the impact on your data. 1. Using Table 5, determine the percent of gDNA contamination present. For example, if the ∆Cq (no-RT control Cq – cDNA Cq) for a given sample is seven or greater, then less than 1% of the DNA present in the sample is gDNA, which would be considered insignificant. Table 5. Determining percent of gDNA contamination.
2. If the lower expressing assay has a longer amplicon, >150 bp, then consider redesigning the assay to be shorter or equivalent in length to the higher expressing gene. Shorter amplicons typically can have greater PCR efficiencies. 3. Choose assays with more similar expression levels, if possible, to avoid reagent competition. If this strategy is not possible, optimize the assays using a primer-limiting strategy to limit the available primer for the higher expressing gene.
Ordering Information Catalog # Description SsoAdvanced Universal Probes Supermix 172-5280 2 ml (2 x 1 ml vials), 200 x 20 μl reactions 172-5281 5 ml (5 x 1 ml vials), 500 x 20 μl reactions 172-5282 10 ml (10 x 1 ml vials), 1,000 x 20 μl reactions 172-5284 25 ml (5 x 5 ml vials), 2,500 x 20 μl reactions 172-5285 50 ml (10 x 5 ml vials), 5,000 x 20 µl reactions Two-Step Reverse Transcription Reagents 170-8842 iScript Advanced cDNA Synthesis Kit for RT-qPCR, 50 x 20 μl reactions 170-8843 iScript Advanced cDN
Bio-Rad Laboratories, Inc. Web site www.bio-rad.