
Manual


SmartSpec 3000 will now direct you to insert blank (if you chose that option above) and
the to insert the specified standard. When the absorbance data have been collected,
SmartSpec 3000 will offer you an opportunity to continue re-reading other samples.
• If you want to re-read another sample, press Enter. Otherwise press Select to
toggle from Yes to No and press Enter.
• If you have completed the editing, press the left arrow key to return to the assay and
SmartSpec 3000 will complete the calculation of the standard curve.
D. Completing the standard curve. SmartSpec 3000 will now calculate the equation of the
new standard curve and offer you a chance to see the slope, intercept, and correlation
coefficient of the curve. All this information will be printed at the end of the assay if you
choose to print the full report. You may want to view the correlation coefficient before
completing the assay; if it is too far from 1.000, you may have constructed a poor standard
curve and the concentration calculations may not be very accurate. At the end of the assay,
you will be offered a chance to save the standard curve into memory for future use, either
as a standard curve or to compare to another standard curve.
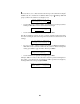
After the last standard is read, you will see
and then once the calculations are completed.
• To view the correlation coefficient of the new standard curve, press Select to toggle
from No to Yes and then press Enter.
r2 refers to the square of the correlation coefficient and is a value between 0 and 1 with 1
representing a perfectly straight line (see discussion above). The general equation of the
curve fit is presented in the top right part of the display
Concentration = Absorbance*Slope + Intercept
• Press 0 to see the slope. Return to the assay by pressing the right arrow key.
• Press 0 to see the intercept. Press the right arrow to return to the assay or press the left
arrow key to see the slope displayed again.
38
Slope (M) = xx.xx exx
<=Back 0=More >=Continue
Intercept (I)=xx.xx e xx
<=Back 0=More >=Continue
Want to view info on new
std curve now? No >=Help
r2=x.xxx CONC=ABS*M +I
0=Show more >=Continue
Calculating
Standard Curve
Continue rereading
Standards? Yes
1. Edit Concentrations
2. Reread a Std <=Back