
Instruction Manual


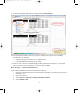

7. Plot the peaks with the filtering option turned off:
a. Select all 8 spectra.
b. Click the data analysis icon . The Analysis Settings dialog opens.
c. Open the Filtering tab and deselect the On checkbox.
d. Click OK.
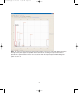
8. Plot all 8 spectra. Using the peak selection tool, select all 7 peaks. Each spectrum should
resemble that shown below (intensities relative to each other may vary). Additional peaks
other than those indicated may consist of matrix, doubly-charged peaks, dimers or other
multimers, salt peaks, etc., as for any mass spectrum.
Peak Name Molecular Weight (Da)
1 Arg-8-vasopressin 1084.247
2 Somatostatin 1637.903
3 Dynorphin A 2147.5
4 ACTH 2933.5
5 Beta endorphin 3465
6 Arg-insulin 5963.8
7 Cytochrome C 12230.92
23
10010680A.qxp 8/17/2007 1:58 PM Page 23