
Instruction Manual


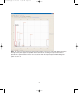


9. Plot all 8 spectra (do not select the first optimization spectrum). Using the peak selection
tool, select the Arg-8-vasopressin (1,084.247 Da) peak. Zoom in to ensure correct peak
selection.
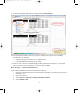
10. Export the data following the instructions in Appendix C and selecting the parameters for
export in the following order:
• Array bar code
• Spot name
• Substance mass
• Intensity
• Resolution
• S/N
11. Paste data into the ProteinChip SELDI OQ form, data sheet “Test 3 Resolution 1 kD”.
12. The spreadsheet indicates if the test passed or failed. If the test fails, run the HV conditioning
procedure (maintenance procedure 1) and repeat the test. Contact technical support if the
test fails a second time.
21
10010680A.qxp 8/17/2007 1:58 PM Page 21