Instruction Manual
Manuals
Brands
Bio-Rad Manuals
Measuring instruments
ProteinChip Qualification and Calibration Kits
21
22
23
24
25
26
27
28
29
30
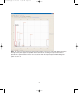
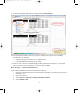
8.
Plot the peaks with the filtering option tur
ned off:
a.
Select all 8 spectra.
b
.
Clic
k the data analysis icon
.
The
Analysis Settings
dialog opens.
c.
Open the
Filtering
tab and deselect the
On
checkbo
x.
d.
Click
OK
.
20
10010680A.qxp 8/17/2007 1:58 PM Page 20
1
...
...
21
22
23
24
25
...
...
35