0010680A.qxp 8/17/2007 1:58 PM Page FC1 ® ProteinChip OQ Kit Instruction Manual and Documentation Catalog #C70-00080 For use with the ProteinChip SELDI system, Personal or Enterprise Edition, with embedded system processor (ESP) version 1.1.
10010680A.qxp 8/17/2007 1:58 PM Page FC3 Notices No part of this publication may be reproduced or transmitted in any form or by any means, electronic or mechanical, including photocopy, recording, or any information storage or retrieval system, without permission in writing from Bio-Rad. Bio-Rad reserves the right to modify its products and services at any time. This user guide is subject to change without notice.
10010680A.qxp 8/17/2007 1:58 PM Page i Table of Contents Chapter 1 1.1 1.2 Chapter 2 2.1 2.2 2.3 2.4 Introduction ............................................................................................1 Product and Protocol Description........................................................................1 Storage and Handling..........................................................................................2 Use of the ProteinChip® OQ Kit ...............................................
10010680A.qxp 8/17/2007 1:58 PM Page 1 Chapter 1 Introduction Qualification of analytical instruments is a formal process of documenting that an instrument is fit for its intended use and that it is maintained and calibrated. • Installation qualification (IQ) checks that the correct system or instrument was received and that it was properly installed. IQ is performed by a Bio-Rad service engineer following installation of the ProteinChip® SELDI system.
10010680A.qxp 8/17/2007 1:58 PM Page 2 Completion of each maintenance procedure and test is tracked using the ProteinChip SELDI OQ form, a Microsoft Excel spreadsheet supplied on the CD. Test data are exported to the ProteinChip SELDI OQ form, which then calculates whether the test passed or failed.
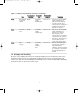
10010680A.qxp 8/17/2007 1:58 PM Page 3 Table 1. Summary of procedures and tests (continued). Test Recommended Frequency Consumable Used Estimated Time Required Description Test 2 Mass drift and Weekly resolution at 5.96 kD ProteinChip peptide standard array 20 min to 1 hr This test uses the ProteinChip peptide standard array to measure the mass drift and resolution of insulin. These measurements are compared to a specification, and a pass/fail disposition is obtained.
10010680A.qxp 8/17/2007 1:58 PM Page 4 Chapter 2 Use of the ProteinChip OQ Kit 2.1 Overview This chapter outlines the protocols used to perform the procedures and tests that comprise the ProteinChip OQ kit.
10010680A.qxp 8/17/2007 1:58 PM Page 5 2.2 File and Protocol Setup Complete this procedure the first time you run the ProteinChip OQ kit. This procedure sets up the file structure necessary for storing the protocols and creates the routines for high voltage conditioning (procedure 1) and mass accuracy (test 4). Task Step 1 Import Protocols From CD Import the protocols supplied on the CD into the Protocols folder of ProteinChip data manager software: 1.
10010680A.qxp 8/17/2007 1:58 PM Step 3 Page 6 1. Set Up the High Voltage (HV) Conditioning Routine Insert a blank ProteinChip array into the reader. If blank arrays are not available, use expired arrays or arrays that have already been used. a. For the Enterprise Edition instrument: place a cassette filled with 12 blank or used arrays into the instrument. b. For the Personal Edition instrument: insert a blank ProteinChip array. 2.
010680A.qxp 8/17/2007 1:58 PM Page 7 6. In the Explorer pane of ProteinChip data manager software, select Projects and click on any spectrum file (for example, the spectrum obtained during installation). 1. Select Spectra > Calibrate > Internal Calibration. 2. Select Create calibration protocol.
10010680A.qxp 8/17/2007 1:58 PM Page 8 3. In the Calibration protocol name field, enter OQ Mass Cal. 4. Select [Arg8]-Vasopressin (1084.247) from the drop-down list, and click Add (keep the default values of 3% of expected peaks and minimum signal/noise of 5). 5. Select Dynorphin A (2147.5) from the drop-down list, and click Add (keep the default value of 3% of expected peaks and signal/noise of 5). 6. Select Beta-endorphin (3465.
10010680A.qxp 8/17/2007 1:58 PM Page 9 2.3 OQ Maintenance Procedures 2.3.1 Maintenance Procedure 1 –– High Voltage (HV) Conditioning This procedure helps to decontaminate the surfaces of the ProteinChip instrument and is essential for obtaining correct test results. Run this procedure weekly using any blank ProteinChip array (or an array that has already been used). The procedure takes 1–2 hr to complete.
10010680A.qxp 8/17/2007 1:58 PM Page 10 1. Insert the ProteinChip detector calibration array into the instrument. Note: For the Enterprise Edition instrument, place the array into slot 1 of a cassette and fill the rest of the slots with blank or used ProteinChip arrays. 2. Open the instrument’s interactive web page (http://pcs4000-####/index.jsp, where #### is the instrument serial number). If the instrument is under local control, the web page will only be on the local computer.
10010680A.qxp 8/17/2007 1:58 PM Page 11 7. The time required to complete this procedure is variable, and it may require up to several hours as the instrument continually collects data of a specific intensity. If the calibration routine does not complete, run the procedure again with unused spots. 8. Once the procedure is complete, open ProteinChip data manager software, select the instrument, and select Instrument > Reinitialize Instrument. 9. The maintenance procedure is complete.
10010680A.qxp 8/17/2007 1:58 PM Page 12 2.4 OQ Tests 2.4.1 Test 1 –– Detector Sensitivity This test uses the ProteinChip detector qualification array to measure the signal-to-noise ratio (S/N) of immunoglobubulin (IgG) at two different concentrations (10 fmol and 140 fmol). Measurements are compared to a specification, and a pass/fail disposition is obtained. Array Type ProteinChip detector qualification array Usage Information Use once and discard; do not open until ready to use.
10010680A.qxp 8/17/2007 1:58 PM Page 13 6. Plot the peaks with noise set to 12,000 Da: a. Select all 8 spectra. b. Click on the data analysis icon c. Open the Noise tab and set Start Measuring Noise From to 12,000 Da. Click OK. . The Analysis Settings dialog opens.
10010680A.qxp 8/17/2007 1:58 PM Page 14 7. Plot all 8 spectra and select the IgG peak using the peak selection tool. Note: Spots with high concentrations (spots A, C, E, and G) alternate with those with low concentrations (spots B, D, F, and H). Due to the different concentrations on different spots, it is critical to export the peak data with the spots in alphabetical order from A to H. 8.
10010680A.qxp 8/17/2007 1:58 PM Page 15 2.4.2 Test 2 — Mass Drift and Resolution 5.96 kD This test uses the ProteinChip peptide standard array to measure the mass drift and resolution of insulin. These measurements are compared to a specification, and a pass/fail disposition is obtained. Array Type ProteinChip peptide standard array Usage Information Each test uses 1 partition on all 8 spots on the array. The array can be used up to 20 times (5 times on each of 4 partitions).
10010680A.qxp 8/17/2007 1:58 PM Page 16 6. Run the same protocol on partition “n” of 4 for all 8 spots. Record the partition number on the usage chart provided with the product packaging. 7. Make sure that a peak intensity of 50–500 µA is visible on each spot. If peak intensities appear out of this range, change the laser energy and run the test again.
10010680A.qxp 8/17/2007 1:58 PM Page 17 8. Plot the peaks with the filtering option turned off: a. Select all 8 spectra. (Do not select the first laser optimization spectrum.) b. Click the analysis settings icon. The Analysis Settings dialog opens. c. Open the Filtering tab and deselect the On checkbox. d. Click OK.
10010680A.qxp 8/17/2007 1:58 PM Page 18 9. Plot all 8 spectra. Using the peak selection tool, select the insulin peak (5.963 kD) in all spectra. 10. Export the data following the instructions in Appendix C and selecting the parameters for export in the following order: • • • • • • Array bar code Spot name Substance mass Intensity Resolution S/N 11. Paste the data into the ProteinChip SELDI OQ form, data sheet “Test 2 Mass Drift and Resolution”. 12.
10010680A.qxp 8/17/2007 1:58 PM Page 19 2.4.3 Test 3 –– Resolution at 1 kD This test uses the ProteinChip peptide standard array to measure the resolution of Arg-8-vasopressin. To do this, a higher-resolution, lower source mode (15 kV) is employed rather than the default high-sensitivity source mode (voltage 25 kV).These measurements are compared to a specification, and a pass/fail disposition is obtained.
10010680A.qxp 8/17/2007 1:58 PM Page 20 8. Plot the peaks with the filtering option turned off: a. Select all 8 spectra. b. Click the data analysis icon c. Open the Filtering tab and deselect the On checkbox. d. Click OK. . The Analysis Settings dialog opens.
10010680A.qxp 8/17/2007 1:58 PM Page 21 9. Plot all 8 spectra (do not select the first optimization spectrum). Using the peak selection tool, select the Arg-8-vasopressin (1,084.247 Da) peak. Zoom in to ensure correct peak selection. 10. Export the data following the instructions in Appendix C and selecting the parameters for export in the following order: • • • • • • Array bar code Spot name Substance mass Intensity Resolution S/N 11.
10010680A.qxp 8/17/2007 1:58 PM Page 22 2.4.4 Test 4 — Mass Accuracy This test uses the ProteinChip peptide standard array to test the mass accuracy of the system’s internal and external calibrations. These measurements are compared to a specification, and a pass/fail disposition is obtained. Array Type ProteinChip peptide standard array Usage Information Each test uses 1 partition on all 8 spots on the array. The array can be used up to 20 times (5 times on each of 4 partitions).
10010680A.qxp 8/17/2007 1:58 PM Page 23 7. Plot the peaks with the filtering option turned off: a. Select all 8 spectra. b. Click the data analysis icon c. Open the Filtering tab and deselect the On checkbox. d. Click OK. . The Analysis Settings dialog opens. 8. Plot all 8 spectra. Using the peak selection tool, select all 7 peaks. Each spectrum should resemble that shown below (intensities relative to each other may vary).
10010680A.qxp 8/17/2007 1:58 PM Page 24 Note: To ensure correct placement of the peak marker, zoom in on each peak during selection. Though some plots appear acceptable when zoomed out, zooming in may reveal incorrect placement of peak markers. This is more accurate when the expected peak width dialog box option is set to 5.
10010680A.
10010680A.qxp 8/17/2007 1:59 PM Page 26 9. Zoom in and check that all 7 peaks in all 8 spectra are marked correctly. Failure to do so may result in incorrect results. Close the plot. Mass Accuracy — External Calibration Test Perform this test BEFORE the internal calibration test. 1. Click on the spectrum for spot D. 2. Select Spectra > Calibrate > Apply Calibration Protocol. 3. Select OQ Mass Cal. 4. Click OK. The spectrum flag changes from yellow to green. 5.
10010680A.qxp 8/17/2007 1:59 PM Page 27 9. In the External Table, right-click on cell B3 and select Refresh Data. 10. The spreadsheet indicates if the test passed or failed. The test passes if the following specifications are achieved: • Peptide average mass within 0.1% of calibrant mass • % Standard deviation (pooled CV) of <0.05 11. If the test fails, run the HV conditioning procedure (maintenance procedure 1), and repeat the test. If the test fails a second time, contact technical support.
10010680A.qxp 8/17/2007 1:59 PM Page 28 12. Click OK. The spectrum flag changes from yellow to green for all 8 spectra, once calibration is complete. 13. Export the data following the instructions in Appendix C and selecting the parameters for export in the following order: • • • • • • • Array bar code Spot name Substance mass Intensity Resolution S/N Peak # 14. Paste the data into the ProteinChip SELDI OQ form, data sheet “Test 4 Mass Calibration”. Paste the data into cell V41. 15.
10010680A.
10010680A.qxp 8/17/2007 1:59 PM Page 30 Appendix B Protocol Acceptance Form Bio-Rad Laboratories recommends that the operational qualification (OQ) protocols be performed in total on a regular basis to confirm that the ProteinChip SELDI system is performing to specifications, or whenever it is suspected that the instrument is not performing to specifications.
10010680A.qxp 8/17/2007 1:59 PM Page 31 Appendix C Data Export Procedure Use this procedure to export the data obtained during testing to the Microsoft Excel spreadsheet provided with the kit (ProteinChip SELDI OQ form). Following export, open the resulting .csv file using the Excel program and copy and paste the contents into a COPY of the spreadsheet provided. Retain this copy for your records. 1. In the Explorer pane, open the Projects folder and select the spectra to be exported.
10010680A.qxp 8/17/2007 1:59 PM Page BC1 Bio-Rad Laboratories, Inc. Web site www.bio-rad.