Microplate Manager ® 5.
Catalog Number 170-9520 Bio-Rad Technical Services Department Open Monday–Friday, 8:00 a.m. to 4:00 p.m., Pacific Standard Time. Phone: (800) 424-6723, option 2, option 3 (510) 741-6576 Fax: (510) 741-5802 E-mail: LSG.TechServ.US@Bio-Rad.com (U.S.) LSG.TechServ.Intl@Bio-Rad.
Warranty Bio-Rad Laboratories warrants that the Microplate Manager software shall substantially conform, in all operational features, to Bio-Rad’s current specifications as published in Bio-Rad’s user and installation guides and that, when properly installed, it will be free of material defects which affect system performance. The Purchaser must notify Bio-Rad in writing, within 30 days of delivery of the software (not including delivery of any subsequent modifications to the software), of any defect.
this manual and the software program contained herein may not be copied, in whole or in part, without the prior written consent of Bio-Rad, except in the normal use of the software or to make a backup copy. This exception does not allow copies to be made for others, whether or not sold, but all of the materials purchased (with all backup copies) may be sold, given or loaned to another person. Under the law, copying includes translating into another language or format.
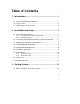
Table of Contents 1. Introduction..............................................................1 1.1 Overview of Microplate Manager...................................................1 1.2 Types of Files ...............................................................................3 1.3 New Features in Version 5.0.........................................................4 2. Installation and Setup..............................................7 2.1 Instrument Specifications...................................
3.2 Opening and Saving Files ...........................................................17 3.3 Reading Data from Other Applications........................................17 3.4 Quick Start..................................................................................17 3.5 Typical Scenarios........................................................................18 4. Templates ............................................................... 23 4.1 Opening a Template ......................................
5.2 Features Unique to Endpoint Protocols.......................................58 5.3 Features Unique to Kinetic Protocols ..........................................59 5.3.1 5.3.2 Reading Sets ..............................................................................60 Analysis Options .........................................................................61 5.4 Features Unique to Multiple Plate Protocols ...............................64 6. Data Formatting and Reports.............................
. Quick Guides........................................................ 107 8.1 Creating a New Template .........................................................107 8.2 Creating and Running a New Kinetic Protocol with a Stored Template .......................................................................108 8.3 Creating and Running a New Kinetic Protocol and Creating the Template Simultaneously....................................................109 8.
List of Figures Figure 1. Workflow of Microplate Manager............................................................2 Figure 2. Microplate Manager desktop icon. .........................................................9 Figure 3. Communications Setup dialog box.........................................................9 Figure 4. Ultramark Setup dialog box. .................................................................10 Figure 5. Model 550 Setup dialog box. ................................................
Figure 37. Figure 38. Figure 39. Figure 40. Figure 41. Figure 42. Figure 43. Figure 44. Figure 45. Figure 46. Figure 47. Figure 48. Figure 49. Figure 50. Figure 51. Figure 52. Figure 53. Figure 54. Figure 55. Figure 56. Figure 57. Figure 58. Figure 59. Figure 60. Figure 61. Figure 62. Figure 63. Figure 64. Figure 65. Figure 66. Figure 67. Figure 68. Figure 69. Figure 70. Figure 71. Figure 72. Figure 73. x Ultramark reader door controls. .........................................................
1. Introduction This manual assumes that you are familiar with your computer and standard Windows commands and functions, such as opening, closing, and saving files, and moving and clicking your mouse. Some of the features and functions in Microplate Manager may be slightly different depending on whether you are using the Ultramark, Model 550, or Benchmark microplate reader. These differences are noted in the text. 1.
Microplate Manager User Guide Select Type of Reading (Endpoint, Kinetic, or Multiple Plate Protocol) Define or Select Microplate Template Take Reading Generate and Format Reports Print/Export Data Figure 1. Workflow of Microplate Manager Microplate Manager can perform three general types of microplate readings. These are called “protocols.” • Endpoint protocols are used to acquire a single absorbance reading from each well.
Chapter 1. Introduction Finally you take the reading. If you want to use the particular protocol you’ve created again, you can save it as a file. Once absorbances have been read, you can save them as a data file and display them in a selection of reports. Your data can be viewed, printed, or exported to other applications. 1.2 Types of Files There are two types of files used by Microplate Manager. Protocol files contain the settings for reading a microplate.
Microplate Manager User Guide Data Files The data file contains the raw data from the microplate reader. It has the extension .mpm. For an endpoint reading, this data consists of the individual absorbance readings from the wells on the microplate. For a kinetic reading, this data is the time course series of the individual absorbance readings. A multiple-plate reading creates a new data file for each plate; each file contains endpoint absorbance measurements.
Chapter 1. Introduction • Major improvements in associating protocols and templates. • More flexibility in tagging outliers in replicate sets. • Up to 12 different assays on one plate, each with its own blanks, controls, and standards. • More status bar and cursor feedback in templates and reports, including well information and cursor positions. • External standards and standard curve checking. A quantitative method for comparing two standard curves is now available.
2. Installation and Setup 2.1 Instrument Specifications 2.1.1 Host Computer and Operating System Microplate Manager will run under Windows 95, Windows 98, or Windows NT 4.0. The host machine must be based on a Pentium Intel class CPU or higher. It should have a hard disk of at least 200 MB, and a minimum of 16 MB RAM. It must have a monitor and video card capable of displaying 256 colors at 1024 by 768 resolution. There must be a SCSI-2 port available for connecting to the reader.
Microplate Manager User Guide A serial cable is included with the Model 550 or Benchmark and is used to connect the instrument to the host PC. Make sure all devices are turned off before making or changing cable connections. See the hardware manual for details. 2.3 Attaching the Hardware Protection Key A hardware protection key (HPK) is included with this version of Microplate Manager. You must attach the HPK to your computer before you can run Microplate Manager.
Chapter 2. Installation and Setup 2.5 Starting Microplate Manager To start Microplate Manager, click on the application icon on your desktop or select Microplate Manager from the Programs directory on your Start menu. Figure 2. Microplate Manager desktop icon. The software will open, displaying the menu bar, main toolbar, main application window, and status bar. 2.6 Selecting a Serial Port The Ultramark connects to the computer via the SCSI port.
Microplate Manager User Guide When you open a protocol, Microplate Manager will look first for a reader at the serial port you select. If a reader is not found at that port, the software will scan the remaining ports as well as the SCSI bus for a reader. If a reader is found at a particular port, that port will be selected. If no reader is found at any serial port or the SCSI port, you will receive an error message. 2.
Chapter 2. Installation and Setup Click on OK to implement your changes. 2.7.2 Model 550 Setup Select Model 550 Setup from the OPTIONS menu Figure 5. Model 550 Setup dialog box. For each filter, enter the appropriate wavelength. The wavelengths of the filters that are shipped with the Model 550 will be included with your reader documentation. If you change any of the filters, you will need to change these settings. Click on OK to implement your changes. 2.
Microplate Manager User Guide Figure 6. Preferences dialog box. In the Preferences dialog box, you can enter or select the Default File Location for opening and saving files. To select the directory, click on the “...” button next to the text field and scroll through the directory tree. You can also type the full directory path and name directly in the field. If an invalid path is entered, it will be ignored, and the working directory will be used as the home directory.
Chapter 2. Installation and Setup When you are finished making your selections, click on the OK button. 2.9 Sample Data Files Six sample data files are installed with Microplate Manager, in a directory called Examples in your Microplate Manager directory on your hard drive. Figure 7. Examples directory. Clicking on any one of these data files will open Microplate Manager and display the template for that file. Then you can view the sample data using the commands described in Chapter 6.
3. Getting Started 3.1 Menus, Toolbars, and Other Features Menu Bar Microplate Manager has a standard menu bar with pulldown menus that include all the commands and functions in the software. The available menus and menu items are different depending on the specific actions you are performing. For example, when the software first opens, the menus will include basic file opening and set-up features. When you are formatting a template, the menus will change to include functions for formatting a template.
Microplate Manager User Guide Right-click Commands You can access many of the commands associated with the action you are currently performing by using the right mouse button. For example, if you are in the process of defining an assay on your template, clicking the right mouse button will display many of the commands associated with that action. The commands are displayed in a drop-down menu next to the cursor. Figure 9. Example of commands available by clicking right mouse button.
Chapter 3. Getting Started 3.2 Opening and Saving Files Microplate Manager has two basic file types: Protocol files and data files. Protocol files have a .kpr, .epr., or .mpr extension. Data files have a .mpm extension. To open an existing protocol file or data file, select Open... from the FILE menu , select the name of the file you want to open, and click on the Open button. To save a protocol file, select Save Protocol or Save Protocol As... from the FILE menu.
Microplate Manager User Guide 2. Open Microplate Manager. 3. Under the FILE menu, select New Endpoint Protocol, New Kinetic Protocol, or New Multiple Plate Protocol, depending on the type of analysis you want to perform. The protocol dialog box will open. 4. In the dialog box, select the size of your microplate from the Plate Type: pulldown list and click on the Run button. The plate will be read and your raw absorbance or velocity data will be displayed.
Chapter 3. Getting Started Figure 10. Performing an endpoint reading. You have a data file saved from a previous run with the template you want to use for this plate, so you click on Pick Template... and choose that data file. Now that everything is set, you click on the Run button. After the reading is complete, the raw data values pop up. The plate template is also displayed.
Microplate Manager User Guide Scenario 2. Kinetic Assay You want to perform a new kinetic assay. From the FILE menu, you select New Kinetic Protocol. The Kinetic Protocol dialog box opens. For this assay, you would like to make five readings at 21-second intervals followed by 20 readings at one-minute intervals. You want to shake the plate for one second before each of the first five readings. To accomplish this, you define two reading sets.
Chapter 3. Getting Started Scenario 3. Using External Standards and Curve Comparisons You are running the same assay on many samples. To increase throughput, you would like to place a set of standards on the first plate and then use those to determine unknown concentrations on all subsequent plates. Near the end of the day, you want to check the consistency of the readings by comparing the external standards (from the first plate) to a fresh set of standards.
Microplate Manager User Guide Figure 12. Comparing external and internal standards.
4. Templates Templates allow you to specify the number of wells (Ultramark only) and the layout of the standards, unknowns, controls, etc. on your microplates. You use this layout information both when reading the microplate and when analyzing your data and organizing it in your final report(s). ½ Ultramark only: This version of Microplate Manager allows you to capture and display an image of your microplate using the Custom Template feature.
Microplate Manager User Guide dialog box. Select the appropriate directory and double-click on the template file to open it. Template files have a .mpm extension—that is, they are saved as data files, even if no data has been read into the template. Templates with no data have “0.000” entered into the data fields. 4.1.2 Opening a New Template To open a new template, select New Template from the FILE menu. (See Chapter 5 for information on selecting a new template from within a protocol dialog box.
Chapter 4. Templates Creating a Custom Template Format ½ This feature is only available to users of the Ultramark. If the layout of your microplate is not listed, select Custom. A dialog box will open, allowing you to create a new template format. Figure 14. Creating a custom template. In this dialog box, if the template format you want is listed, simply double-click on it to select it (or click on it once to highlight it, then click on the Select button to select it).
Microplate Manager User Guide Figure 15. Defining the format of a plate. In the Define Plate Format dialog box, you can enter the numbers of Columns and Rows in your microplate in the appropriate fields. You can also choose how your columns and rows should be labeled—with Letters or Numbers. The default labeling is numbers for columns and letters for rows; however, if the number of rows exceeds 26, numbers will be substituted for letters.
Chapter 4. Templates Figure 16. Entering the physical dimensions of your plate. In the Physical Dimensions dialog box, you can enter the distance in millimeters from the edges of the plate to the centers of the corner wells. Entering the offset distances for the top left well (x1, y1) and bottom right well (x2, y2) will provide the dimensions for the entire plate. Refer to the diagram in the dialog box for guidance on which distance to enter into which field.
Microplate Manager User Guide When you have specified the physical dimensions of your plate, click on the OK button. 4.2 Viewing the Template You can display a template in three sizes. Under the VIEW menu, select Show Full Size, Show Compact, or Show Tiny. The smaller sizes are useful for viewing larger templates. If a template is too large to fit in the display window, it will be displayed with scroll bars along the right side and bottom of the template window.
Chapter 4. Templates Information about Individual Wells Another source of information about your template is the Well Info dialog box. To open this dialog, click on a well and select Properties from the EDIT menu, or rightclick and select Properties from the drop-down list. This will open the info box. Figure 18. Well Info dialog box. The info box shows the number, type, and reading of the well you selected. It also lists all the wells in its replicate group, and shows the dilution for the replicate group.
Microplate Manager User Guide Toolbar Grid Figure 19. Blank 12 x 8 template. Using the template toolbar, you define the wells that contain your standards, unknowns, blanks, and controls. You can also identify replicate groups within your unknowns and standards. Wells may be grouped by assay within the template, and you can enter concentrations of standards and dilution factors for unknowns.
Chapter 4. Templates • Customized name for each assay. • Notes about each assay to be printed on reports. • Type of regression for each assay. • Type of axes for each regression. • External standards (if any) to be applied to each assay Types of Wells A template allows you to define six different types of wells: • Standard wells contain your standards. They are indicated by a circle with a number at the center that indicates the replicate group. • Unknown wells contain your unknowns.
Microplate Manager User Guide Unknown Standard Blank Positive control Standard Replicate Group 1 Negative control Undefined Assay 2 Assay 1 Figure 20. Example of a plate template with two different assays defined. Replicate Groups A replicate group is a group of wells with the same standard or unknown.
Chapter 4. Templates Concentrations and Dilution Factors Concentrations of standards and dilution factors for unknowns may also be entered using separate dialog boxes. If the concentration or dilution values are in a geometric series, you only need to enter the initial value and the ratio; Microplate Manager will calculate the remaining values. 4.4 Formatting a Template After you have opened a template (see section 4.1.2), you are ready to format it.
Microplate Manager User Guide Some additional assay-related commands are located on the EDIT and ASSAY menus. Undo and Redo Formatting Commands If you make a mistake while formatting, select Undo Formatting from the EDIT menu. This will undo the last formatting change you made to the plate template. Once undone, the formatting can be redone by choosing Redo Formatting from the EDIT menu.
Chapter 4. Templates Figure 22. Defining an assay with the Assay tool. When the mouse is released, a new assay will be created, and all the wells in the assay will have the same color. You can define up to 12 assays on a single template. When you are done defining your assay(s), click on the Select button on the toolbar to change your cursor back to normal functionality. ½ When a new template is first displayed, all wells are considered to be part of Assay 1.
Microplate Manager User Guide Figure 23. Assay Information dialog box. Each assay will have its own tab. Click on the tab of the assay you want to change. Enter a new assay name and notes about the assay in the appropriate fields. Assays may have any name up to 30 characters in length. Notes are printed with the reports. To change the display color, use the pulldown menu under Display Color to select from the available colors.
Chapter 4. Templates You can then click and/or drag on your template to define your well types. Clicking on a particular well will mark that well as a single standard or unknown. Clicking on several wells in succession will number them sequentially. You can also number your wells sequentially by using the Autofill buttons. Click on Autofill Left to Right and drag across a row of wells with your Standard or Unknown pointer. The wells will be numbered sequentially from left to right.
Microplate Manager User Guide Turn Off Autofill selected Figure 25. Defining a replicate groups of unknowns. Dragging across another group of wells will assign those to a second replicate group, and so on. Suppose you have several replicate groups aligned in single rows or columns. If there are the same number of replicates in each group, you can use the Autofill buttons and the # button to define these groups quickly and easily.
Chapter 4. Templates Autofill Left to Right selected Click here to select number of replicates in set (in this case, 4) Figure 26. Defining multiple standard replicate groups in a row. If you drag across multiple rows or columns, the replicate groups will be numbered sequentially, top to bottom and left to right. Standards and unknowns (and replicate groups) are numbered sequentially within each assay. If you have defined more than one assay on your template, each will have its own Unknown 1, 2, 3, etc.
Microplate Manager User Guide • 4.4.3 To undefine wells or replicate groups, click on the Format as Undefined button (or select Undefine from the FORMAT menu) and click or drag on the wells to be undefined. All formatting will be erased from these wells. Step 3. Enter the Concentrations of the Standards If you have identified standard wells on your template, you can enter the concentrations for those standards. Select Edit Standard Conc... from the EDIT menu. This will open the Edit Standards dialog box.
Chapter 4. Templates Click on the Enter Manually button to directly input the concentrations of your standards. Then type in the concentrations in the appropriate fields in the Conc. column. If a dilution series was created for the standards, the software can calculate the concentrations of each standard. Click on the Enter Automatically button, then click on the button that identifies the standard with the highest concentration and enter that concentration and the dilution factor in the appropriate fields.
Microplate Manager User Guide Figure 28. Edit Unknowns dialog box. Each defined assay has a tab that is labeled with the name of the assay (default names are Assay 1, Assay 2, etc.). Dilutions for each assay are entered separately on a form under each tab. To enter dilutions for Assay 2, click on the Assay 2 tab. Each unknown is listed in the column at the left. The default dilution is 1. Click on the Enter Manually button to directly input the dilutions of your unknowns.
Chapter 4. Templates Click on Calculate when all the information is entered. The dilution factors in the Dilut. column will be automatically updated. To use the automatic calculation feature, the least diluted unknown must be either the first unknown (U1) or the last. Repeat this procedure for each defined assay on your plate. To implement your changes, click on OK. 4.4.5 Step 5.
Microplate Manager User Guide Click on the tab of the assay you want to change, then choose the type of regression method from the OPTIONS menu or from the standard curve toolbar at the bottom of the dialog box. Also select the types of axes from the OPTIONS menu or from the toolbar. The types of axes are linear-linear, linear-log, log-linear, and log-log. For the logistic regression method, only linear axes are available. Repeat this procedure for each assay on your plate.
Chapter 4. Templates Figure 30. External Standards dialog box. If you are already using external standards, the External Standards checkbox will be selected. To stop using external standards, deselect the checkbox and click on OK. To begin using external standards, click on the External Standards checkbox. This will activate the File button. Click on the File button and a dialog box will open. Figure 31. Selecting the source file for the external standards.
Microplate Manager User Guide Select the data file containing the external standards and click on Open. The names of all assays with defined standards within the selected data file will appear in the Source Assay pulldown menu. Figure 32. Selecting the source assay for your external standards. Under the Source Assay pulldown menu, select the assay that contains the desired external standards. When you are finished, click on OK to close the dialog and implement your changes.
Chapter 4. Templates 4.4.7 Step 7. Saving the Template Save the template as a data file by selecting Save Data/Template or Save Data/Template As... from the FILE menu. This will open a standard Save As dialog box. Enter the name of the template and click on Save. The template will be saved with a .mpm extension. If you try to close the file before saving, you will be prompted to save the file before closing.
5. Protocols Protocols contain the settings for controlling the microplate reader. To read a microplate, you must first open a protocol and specify the settings. ½ Some of the features and functions in the protocols are different depending on the type of microplate reader (Ultramark, Model 550, Benchmark) you are using. These differences are noted in the text. The figures depict some functions that are only available with the Ultramark.
Microplate Manager User Guide suffixes .epr (endpoint reading), .mpr (multiple plate reading), or .kpr (kinetic plate reading). ½ Only one protocol may be open at a time. Figure 33. Example of a protocol dialog box (note that some of the functions displayed here are only available with the Ultramark microplate reader). Each protocol dialog box has numerous settings for controlling the microplate reader. Some settings are the same for all protocols, while others are unique to the specific type of protocol.
Chapter 5. Protocols 5.1 Features Common to All Protocols All three protocol types share basic reading parameters such as measurement wavelength, reader type, and delay; basic plate template and analysis parameters; reporting features; and functions for saving the protocol and running the reader. 5.1.1 Reader Identification When you select a new or existing protocol from the FILE menu, the software first scans for the SCSI or serial port connection to the microplate reader.
Microplate Manager User Guide After you select the template, it is displayed on the screen and simultaneously copied into the protocol file. Selecting a New Template (Ultramark only) If you are connected to an Ultramark, you can select a new template from the pulldown list under Plate Type: in the center of the protocol dialog box or click on the Custom Plate Type... button to create a new plate type. Custom plate types are displayed inside parentheses.
Chapter 5. Protocols When a template is saved in a protocol file, it will remain there until you select a different template. ½ 5.1.3 If you create or edit a template in one protocol and want to copy it to another protocol, you must first save it as a data file. To do so, you have to click on Run. This will create a data file with a copy of the template in it. You can then save this data file and open it from within the new protocol.
Microplate Manager User Guide Figure 36. Incubator settings. The Setpoint is the temperature that the incubator will warm up to and maintain throughout the reading. The range is 25.0–42.0°C; the default setpoint is 37°C. To change the setpoint, click on the arrows next to the temperature field. The blue status bar displays the current temperature. If you click on the Run button before the incubator reaches the setpoint, a message box will warn you that the setpoint temperature has not been reached. 5.1.
Chapter 5. Protocols 5.1.7 Reports You can select certain reports to be automatically displayed and/or printed after a reading is taken. Click on the Reports... button to open a dialog box listing the available reports. Figure 38. Reports dialog box for endpoint and multiple plate protocols. The plate template is always displayed immediately after a reading. For endpoint and multiple-plate protocols, the Raw Data Report is also auto-displayed. For kinetic protocols, the Kinetic Plots Report is displayed.
Microplate Manager User Guide before the reports have been generated, you will be prompted for the labeling information if it has not already been entered. For example, if the labels “Date” and “Operator” are created in a protocol file, then when that protocol is run, a dialog box will pop up after plate reading prompting you to type the date and the operator’s name. Both the label (e.g., Date) and the label contents (e.g., July 4, 1999) are printed on the report. In the Reports dialog box, click on Labels.
Chapter 5. Protocols 5.1.8 Running a Protocol Once all the parameters have been set, click on the Run button to begin taking a reading. While the reading is in progress, the Run button will change into a Stop button and the other controls will become inactive. A digital clock will display the elapsed time. Figure 40. Example of a running protocol. Clicking on Stop will stop the reading in progress.
Microplate Manager User Guide 5.2 Features Unique to Endpoint Protocols Endpoint protocols collect one absorbance reading for each well on a microplate. To run a new endpoint protocol, select New Endpoint Protocol from the FILE menu. Absorbance Delay button Initial wait field Figure 41. Features unique to an endpoint protocol dialog box. The controls common to all protocols are described in the previous section. The controls specific to endpoint protocols are described below.
Chapter 5. Protocols Absorbance Delay Absorbance Delay delays data collection until a well that you select reaches a specified level of absorbance. To access the controls for this feature, click on the Absorbance Delay button. Figure 42. Absorbance Delay dialog box. In the Absorbance Delay dialog box, click on the Use Absorbance Delay checkbox to enable this feature. Select the row and column number of the well whose absorbance you want to monitor from the pull-down lists.
Microplate Manager User Guide To run a new kinetic protocol, select New Kinetic Protocol from the FILE menu. Reading sets Analysis options Figure 43. Features of a kinetic protocol dialog box. The controls common to all protocols are described in section Features Common to All Protocols. The controls specific to kinetic protocols are described below. 5.3.
Chapter 5. Protocols To activate a reading set, click on the checkbox next to the set number. Only sets that are checked will be run. Enter the number of readings you want to take in the Readings column. Next enter the interval between the start of two consecutive readings in the Interval column. Note that this is the minimum time necessary for one complete reading plus any mixing time you specify. For a standard 12 x 8 (96-well) plate, the smallest interval you can specify is 7 seconds.
Microplate Manager User Guide Figure 44. Analysis Options in the kinetic protocol dialog box. The settings in this dialog box will only affect the analysis of your data. They will not change the raw data that is gathered. Time and Absorbance Limits In this dialog, you can specify a time range and/or an absorbance range for your data points. If time limits and/or absorbance limits are set, then only data points within these limits will be used to calculate the reaction velocity.
Chapter 5. Protocols To set absorbance limits, select the appropriate checkbox(es) and enter ODs in the appropriate field(s). If none of the limit checkboxes is selected, then all data points will be included in the velocity calculations. Velocity There are two methods for calculating kinetic velocities. The first fits a line to the entire data set and defines the reaction velocity as the slope of this line.
Microplate Manager User Guide 5.4 Features Unique to Multiple Plate Protocols The multiple plate protocol will perform single endpoint readings on a series of plates and store these readings in separate data files with a common root file name. This protocol may be used with or without a stack loader. With a stack loader, you program the loader to load your plates in sequence.
Chapter 5. Protocols Absorbance Delay button Filename field Multiple plate settings Initial wait field Figure 45. Features of a Multiple Plate Protocol dialog box. The controls common to all protocols are described in section 5.1. The controls specific to multiple plate protocols are described below. Initial Wait The Initial Wait option delays the start of the protocol by the specified number of seconds after you click on Run. This is useful for excluding an initial lag time in delayed reactions.
Microplate Manager User Guide Stack Loader Checkbox If you are connected to Bio-Rad’s Twister stack loader and have installed the associated software, the Stack Loader checkbox will appear checked when you first open the Multiple Plate Protocol window. (If the Twister software is not installed, this checkbox will be unavailable.) If you do not want to use the stack loader, deselect this checkbox.
Chapter 5. Protocols After you have defined your plate types and other configurations in the Twister control panel, select the appropriate plate type from the pull-down menu under Plate Type in the Plate Handler Options dialog box. The Restacking Option buttons allow you to specify whether and how you will restack your plates. Restack at End of Rack will restack the plates after each rack is emptied.
Microplate Manager User Guide a base file name for the resulting data files. File names are then constructed by appending two digits to the base file name. Enter the base file name in the Filename: field. A file path may be entered as well. Clicking on the button next to the Filename: field allows you to browse the directory tree for a directory to save your files in. For example, if you enter c:\mydata\test and read three plates, the resulting data files will be named test-01.mpm, test-02.mpm, and test-03.
Chapter 5. Protocols reading is section, specify an absorbance that is above or below a certain OD value. Below will begin data collection when the measured absorbance is below the specified OD. Above will begin data collection when the absorbance is equal to or greater than the specified OD. Click on the OK button to implement your changes.
6. Data Formatting and Reports After you have run your protocol, your data and the associated template will be displayed automatically. You can then organize your data in a variety of reports and save the data as a data file. To open an existing data file, select Open... from the FILE menu, select the name of the file you want to open, and click on the Open button. Data files have a .mpm extension. 6.
Microplate Manager User Guide • Normalization Report: Similar to the Limit Report, except that the readings are displayed as percentages relative to the limits. • Standard Curve Report: Displays the interpolation curve defined by your standards, as well as associated statistical analyses. Five different regression methods (linear, quadratic, cubic, cubic-spline, and four-parameter logistic) are available.
Chapter 6. Data Formatting and Reports 6.2 Saving Your Data Data is displayed and saved with templates (see Chapter 4 for more information about templates). To save your data, select Save Data/Template or Save Data/Template As... from the FILE menu. This will open a Save As dialog box. Enter the name of the data set/template and click on Save. The data set/template will be saved with a .mpm extension. If you try to close a newly created data set before saving, you will be prompted to save the file. 6.
Microplate Manager User Guide You can highlight multiple number fields by dragging your cursor over the fields. You can highlight rows and columns by clicking on the button at the beginning of the row or column. You can cut or copy your data using key commands: Ctrl + x = cut and Ctrl + c = copy You can paste your data into different rows/columns or into different spreadsheet applications using the key command Ctrl + v. Click on OK to accept your changes.
Chapter 6. Data Formatting and Reports Figure 49. Select Outliers dialog box. Click on the checkbox next to the well number and associated value that you want to flag as an outlier. This well will not be included in any reports, and will not be used to calculate the standard curve. If an outlier well is part of a replicate group, that well will not be used to calculate the average value for the group. When you are finished selecting your outliers, click on OK to implement the changes.
Microplate Manager User Guide 6.5 Editing or Replacing the Template in a Data File After a protocol has been run, the template from the protocol file is automatically copied into the data file and displayed (see Chapter 4 for more information about templates). When you save a data set, the template is saved with it. When you open an existing data file, the template is always displayed with the data. This template may be edited or completely replaced by another template.
Chapter 6. Data Formatting and Reports 6.6 Reports With your data displayed, select the report you want to display from the VIEW menu. The available reports will be different depending on the type of data you have displayed. Endpoint and multiple-plate protocols produce absorbance data; kinetic protocols produce velocity data. To close any of the report windows, click on the Close box in the upper right corner of the window. 6.6.
Microplate Manager User Guide your label in the field in the pop-up box. To insert a label into the label list, select the existing label above which you want to insert the new label, click on the Insert... button, and enter a name for your label in the field in the pop-up box. Figure 51. Dialog box for adding or inserting labels. Click on OK to implement your changes. Back in the Define Labels dialog box, to delete a label from the list, select it and click on the Delete button.
Chapter 6. Data Formatting and Reports 6.6.2 Raw Image Report (Ultramark only) The Raw Image Report is different from other reports in that it is an actual image of your microplate with the wells and absorbance areas highlighted. This report is only available if you performed a plate reading with the Ultramark using a custom template. If you run a protocol using a standard template, well data is collected but no image is generated. (See section 4.1.
Microplate Manager User Guide Viewing an Image The IMAGE menu contains special tools for viewing your images. Figure 54. Image menu. The image is displayed in a window that can be resized by dragging the lower right corner of the window in and out. If Fit to Window is selected in the IMAGE menu, when you resize the window, the image will resize as well.
Chapter 6. Data Formatting and Reports select the one to be displayed by choosing Select from the IMAGE menu and selecting the appropriate image number. When you move your cursor over the image, the cursor location is displayed in the status bar at the bottom of the Microplate Manager window. When the cursor is over a well, the well number will be displayed next to the cursor and in the status bar.
Microplate Manager User Guide Well shape Data extraction area Boundary between microplate wells Figure 55. Close-up of a microplate image. Show Pattern on the IMAGE menu displays the area of the well used for data collection (i.e., the extraction area). This too is specified in the Physical Dimensions dialog box (see below, and in section 4.1.2). Show Translucent Pattern toggles the pattern display between transparent and opaque.
Chapter 6. Data Formatting and Reports dimensions for your template by selecting Physical Dimensions.... See section 4.1.2 for details on these features. Many of these formatting settings affect what part of the image your data is collected from, and thus affect the data itself. For example, if you change the extraction area in the Physical Dimensions dialog box, this will change the area of the well that is used for data collection, which will change the data itself.
Microplate Manager User Guide Absorbance Report Figure 57. Absorbance Report. In the Absorbance Report, the mean absorbance of all the blank wells in an assay is subtracted from the raw absorbance for each non-blank well in the same assay. A negative value will be reported if the mean absorbance of the blank wells is greater than the absorbance of the unknown well. Absorbances are displayed only for standards, unknowns, and positive and negative controls. 6.6.
Chapter 6. Data Formatting and Reports The Velocity Report displays the velocities of your well readings, based on the analysis options you selected when you ran your kinetic protocol. You can reopen the Analysis Options dialog box and change the settings by selecting Analysis Options from the OPTIONS menu. See section 5.3.2 for more information. Adjusted Velocity Report Figure 59. Adjusted Velocity Report.
Microplate Manager User Guide Kinetic Correlation Coefficient Report Figure 60. Kinetic Correlation Coefficient Report. The Kinetic Correlation Coefficient Report displays the correlation coefficient of the velocity segment for each well. The correlation coefficient, or “r” value, is a measure of the precision of the fit of the linear regression to the raw data. An “r” value of 1.00 represents a perfect correlation. See the discussion in section 6.8. Kinetic Standard Errors Report Figure 61.
Chapter 6. Data Formatting and Reports Kinetic Plots Report Figure 62. Kinetic Plots Report. Using the Kinetic Plots Report, you can display a plot of the change in absorbance with time for each well. The absorbance limits, total read time, time limits, and number of readings are listed below the chart. When you move your cursor over the report, the well numbers will appear next to the cursor, and the standard pointer will change to a magnifying glass.
Microplate Manager User Guide Figure 63. Kinetic Zoom Plot. This window shows additional velocity information for a single well. It displays a plot of the best linear curve fit and lists the calculated velocity, intercept, correlation coefficient, and standard error for the graph. Below the calculated values, the absorbance range and time range are listed. ½ 6.6.5 ½ 88 The data in the Kinetic Zoom Plot window is auto-scaled based on the data range for that particular well.
Chapter 6. Data Formatting and Reports Limit Report Figure 64. Limit Report. If you have defined upper and lower limits for your data, each well is tagged with a “+” if its absorbance/velocity is greater than the upper limit, a “*” if its absorbance/velocity is between the upper and lower limit, and a “–” if its absorbance/velocity is below the lower limit. Setting Data Limits The limits can be set or changed by selecting Limits... from the OPTIONS menu. This will open the Limits dialog box.
Microplate Manager User Guide Figure 65. Limits dialog box. Limits are assigned independently for each assay in a protocol. When there is more than one assay, tabs labeled with each assay number appear in the dialog box. To switch from one assay to another, click on the appropriate tab. To set your own limits, select the Use Custom Limits option and enter numbers in the appropriate fields. ½ For kinetic data, your limits will be adjusted velocities; for endpoint data, your limits will be absorbances.
Chapter 6. Data Formatting and Reports Matrix Report Figure 66. Matrix Report. The Matrix Report is similar to the Limit Report (see above), except that the data between the upper and lower limits are divided into 10 equal ranges, numbered 0–9. Each well with data within the limits is assigned a number, based on which range its data falls into. See the description of the Limit Report for instructions on how to set limits.
Microplate Manager User Guide Control Report Figure 67. Control Report. The Control Report displays absorbance or velocity data for each well as a percentage of the range between the positive and negative controls in the assay. Controls are defined in templates. For more information about controls, see section 4.3. If no positive control is defined for the assay, the highest absorbance value or highest velocity among the wells defined as unknowns or standards is used.
Chapter 6. Data Formatting and Reports Normalization Report Figure 68. Normalization Report. The Normalization Report displays absorbance or velocity data for each well as a percentage of a range defined by the limits. To set your limits, select Limits... from the OPTIONS menu. See the description of the Limit Report above for more information about setting limits.
Microplate Manager User Guide Standard Curve Report Linear Quadratic Cubic Logistic Cubic Spline LinearLinear LogLinearLinear Log Log-Log Figure 69. Standard Curve Report. The Standard Curve Report displays the absorbances of the standards plotted against their concentrations, as well as the best curve fit for those data. If replicates have been made of the standards, error bars are also plotted on the graph corresponding to the standard errors.
Chapter 6. Data Formatting and Reports defined, they are plotted together with their respective regression curves (although only the external standards are used to calculate unknown concentrations). In calculating the curve, you can select among five regression methods: Linear, quadratic, cubic, cubic spline, and logistic. To change the regression method, click on the appropriate button at the bottom of the dialog box, or select the desired method under the OPTIONS menu.
Microplate Manager User Guide Unknown Concentrations Report Figure 70. Unknown Concentration Report The Unknown Concentrations Report shows the calculated concentrations of the unknown samples and the dilution and concentration information for all standards. This report also provides statistics for each replicate group of wells, including mean, standard deviation, and coefficient of variation. At the bottom of the window, the type of curve fit and its equation are shown.
Chapter 6. Data Formatting and Reports To change curve fit options or axis types, open the Standard Curve Report and select the desired regression method and axis type from the buttons in the dialog box. 6.7 Standard Curve Comparison When you are using external standards, it is prudent to validate them from time to time. After a large number of readings, you should analyze the standards again and create a new (internal) calibration curve.
Microplate Manager User Guide If there is a significant difference between standard curves that should be essentially identical, the user should investigate the source of this difference. Note that these statistics depend on the type of curve fit chosen. Changing the regression method and axis type will change the analysis of variance. This information will also be printed at the bottom of the Standard Curve Report. An exhaustive discussion on the analysis of variance is beyond the scope of this manual.
Chapter 6. Data Formatting and Reports quadratic, or cubic polynomial regression, because of the oscillatory nature of the resultant fit. In these cases, a local fit (cubic spline) would be preferable. The concentration of unknowns is determined by substituting the mean absorbance values of the unknowns in the regression equation and solving for the concentration. Microplate Manager performs data reduction without artificial limitations or constraints.
Microplate Manager User Guide variation, and the ratio of the explained variation to total variation becomes 1.000. Or, more simply, the closer the correlation coefficient is to 1.000, the better the fit of the regression. Since the cubic spline is a local function, the r value is meaningless and no goodness of fit may be assigned. (The cubic spline forces the curve through all the data points.
7. Data Output This chapter describes Microplate Manager’s functions for printing reports and exporting data. 7.1 Printing All the reports may be printed to any printer supported by Windows. To print a report when a report window is active, choose Print... from the EDIT menu. This will open the standard Windows Print dialog box. Figure 72. Print dialog box. For additional settings such as page orientation, paper source, and resolution, click on the Properties... button.
Microplate Manager User Guide ½ To automatically print reports immediately after a reading has been performed, click on the Reports... button in a protocol dialog box. This will open a list of reports. Click on the appropriate checkbox(es) to print the desired report (s). When the protocol is finished running, the selected report(s) will be printed. See section 5.1.6 for more information. To select the font that will be used to print the report, select Page Setup.. . from the FILE menu.
Chapter 7. Data Output 7.2.1 Exporting Data All text-based data and reports may be exported as tab-separated values or as comma-separated values. You can also export the plate template format. The graphbased reports may not be exported. To export, with your template or text-based data window open, select Export... from the FILE menu. From the Save as type: pull-down list, select the format you want to export in. Templates can be saved in .eps or .epf format.
Microplate Manager User Guide Figure 73. Export to Excel dialog box. Select the Excel formatting features you want, and click on OK to export your data. 7.2.2 Importing Data Files from the previous version of Microplate Manager can be read into this version of the software. Tab-delimited and comma-separated data are also supported (TXT, CSV, LOT, ASC). From Kinetic Collector PC, data files in matrix format, row format, or column format may be imported (MTX, ROW, or COL). 7.2.
Chapter 7. Data Output Line (4 + (# of rows) * (# of cols)): ... ROW Format This format consists of (# of readings + 3) lines. Line 1: “Row” (format signature) Line 2: # of readings (each in its own row) Line 3: #rows#cols (if this line is left empty, 128 is used) Line 4: timestamp1 ... ... Line 5: timestamp2 ...
Microplate Manager User Guide Line ((reading# - 1)*(# of rows + 2) + row# + 4): ... ... Line ((reading# - 1)*(# of rows + 2) + row# + 4): H1H2...
8. Quick Guides 8.1 Creating a New Template See Chapter 4 for details. 1. Choose New Template > 12 x 8 from the FILE menu. 2. Choose Assay from the FORMAT menu (or click on the Assay tool of the template toolbar) and define the location of each separate assay. 3. Choose the appropriate well type (Standard, Unknown, Positive Control, Negative Control, Blank) from the FORMAT menu (or click on the appropriate icon on the toolbar) and define each well in each assay. 4.
Microplate Manager User Guide 9. a. Select Standard Curve Report or Unknown Concentration Report from the VIEW menu. b. Use the tabs to select the assay. c. Choose External Standards... from the OPTIONS menu. d. Choose source file for the external standards. e. Choose the source assay from within the source file. f. Repeat steps b–e for the other assays. g. Close the Standard Curve Report or Unknown Concentration Report. Choose Save Data/Template or Save Data/Template As...
Chapter 8. Quick Guides 5. Click Analysis Options to set the kinetic analysis parameters. 6. Save the protocol by choosing Save Protocol or Save Protocol As... from the FILE menu. 7. Initiate the protocol by clicking the Run button. 8. At the end of the run, save the data by choosing Save Data/Template or Save Data/Template As... from the FILE menu. 8.3 Creating and Running a New Kinetic Protocol and Creating the Template Simultaneously See Chapters 4 and 5 for details. 1.
Microplate Manager User Guide c. Close the Reports dialog box to return to the kinetic protocol. 5. Click on Analysis Options to set the kinetic analysis parameters. 6. Save the protocol by choosing Save Protocol or Save Protocol As... from the FILE menu. 7. Initiate the protocol by clicking on Run. 8. At the end of the run, save the data by choosing Save Data/Template or Save Data/Template As... from the FILE menu. 8.
Chapter 8. Quick Guides 7. At the end of the run, save the data by choosing Save Data/Template or Save Data/Template As... from the FILE menu. 8.5 Creating and Running a New Endpoint Protocol and Creating the Template Simultaneously See Chapters 4 and 5 for details. 1. Select New Endpoint Protocol from the FILE menu. 2. Fill in the information for the protocol window: 3. 4. 5. a. Specify any initial wait. b. Specify any absorbance delay. c. Specify reading parameters.
Microplate Manager User Guide 6. Initiate the protocol by clicking on Run. 7. At the end of the run, save the data by choosing Save Data/Template or Save Data/Template As... from the FILE menu. 8.6 Creating and Running a Multiple Plate Protocol with a Stored Template See Chapter 5 for details. 112 1. Select New Multiple Plate Protocol from the FILE menu. 2. Fill in the information in the Multiple Plate Protocol dialog box: a. Specify any initial wait. b. Specify any absorbance delay. c.
Chapter 8. Quick Guides 7. At the end of the run, save the data by choosing Save Data/Template or Save Data/Template As... from the FILE menu. 8.7 Creating and Running a New Multiple Plate Protocol and Creating the Template Simultaneously See Chapters 4 and 5 for details. 1. Select New Multiple Plate Protocol from the FILE menu. 2. Fill in the user-defined information for the Multiple Plate Protocol window: 3. Fill in the information in the Multiple Plate Protocol dialog box: 4. 5. a.
Microplate Manager User Guide 114 b. Also click on Fill Labels... to enter the text to be printed along with the labels on each report. c. Close the Reports dialog box to return to the protocol. 6. Save the protocol by choosing Save Protocol or Save Protocol As... from the FILE menu. 7. Initiate the protocol by clicking on Run. 8. At the end of the run, save the data by choosing Save Data/Template or Save Data/Template As... from the FILE menu.
9. Glossary Assay: A set of wells grouped together for analysis. Blank: A well used for background subtraction. Endpoint analysis: Analysis based on a single absorbance value per well. Kinetic analysis: Analysis of the rate of change of absorbance for a well over a set period of time. OD (Optical Density): A measure of absorbance. Protocol: A group of settings that control a microplate reader. Includes incubator controls, filter settings, mix times, etc.
10. Ordering Information Catalog Number Product Description 170-9520 Microplate Manager, Version 5.0 170-9521 PC/Microplate Reader Interface Cable Set with SCSI-2 card.
Index Analysis options for kinetic readings, 61 Assays Annotating, 36 Defining, 34 Description, 32 Editing, 35 Communications Setup, 9 Computer and operating system requirements, 7 Concentrations Displaying, 96 Standards, 40 Unknowns, 96 Data Editing, 73 Exporting, 103 Exporting to Excel, 103 Importing, 104 Kinetic formats, 104 Limits, 89 Data files, 4 Changing templates, 76 Editing, 73 Identifying outliers, 74 Opening, 71 Saving, 73 Dilutions, 41 Editing data, 73 Endpoint analysis, 58 Absorbance delay, 59
Microplate Manager User Guide Absorbance delay, 68 Filenames of readings, 67 Initial wait, 65 Stack loader settings, 66 New features, 4 Outliers, identifying, 74 Page setup, 102 Physical dimensions of the microplate, specifying, 26 Plate images, 79 Preferences Advanced, 12 Selecting, 11 Print, 101 Preview, 102 Setup, 55 Protocol files, 3 Protocols Common features, 51 Displaying templates in, 52 Endpoint, 58. See Also Endpoint analysis General, 49 Incubator controls, 53 Kinetic, 59.
Index Stack loaders, 66 Standard curves Comparing external and internal, 97 Description of, 98 Displaying, 94 Limitations, 100 Standards, external Checking, 97 Description, 46 Selecting in template, 44 Variance analysis, 97 Starting Microplate Manager, 9 Status bar, 16 Templates Assays, 34.
Appendix A. Menus The pulldown menus in Microplate Manager change depending on the particular part of the application you are using. For example, if you are editing a template, one set of menu commands are available; if you are preparing a protocols, another set of menu commands will become available. File This is the initial state of the FILE menu.
Microplate Manager User Guide Close closes the current file. All windows associated with the current file are closed. If the file has been modified, you will be prompted to save the changes. Save Data/Template saves the current data and/or template to a file. Save Data/Template As... opens a dialog box in which you can save the current data and/or template under a new file name or to a specific directory. Page Setup... opens a dialog box in which you can select a font for printing. Print...
Appendix A. Menus Edit Standard Conc... opens a form in which you can enter concentrations of standards. Edit Outliers... opens a dialog box in which you can exclude certain wells from all calculations. Set Assay... opens a dialog box in which you can change the assay to which the selected well belongs. Set Replicate Group... opens a dialog box in which you can change the replicate group of the selected well. Properties... displays the attributes of the selected well. Labels...
Microplate Manager User Guide Format This menu is available only when a template is active: Assay changes the pointer to a tool for defining the area of the microplate in which an individual assay is to be carried out. Select changes the pointer to a select tool. Blank–Undefined changes the pointer to tools for setting the well type. No Autofill turns off the autofilling functions.
Appendix A. Menus Ultramark Setup... opens a dialog box in which you can enter filters for the Ultramark microplate reader. Model 550 Setup... opens a dialog box in which you can enter filters for the Model 550 microplate reader. When the Matrix, Limit, Control, or Normalization Report window is open: Limits... opens a dialog box in which you can set the upper and lower limits for the report. External Standards...
Microplate Manager User Guide All open windows are listed at the bottom of the menu. The active window is indicated by a check mark. When more than nine windows are open, More Windows... is appended to the bottom of the menu. Choosing More Windows... opens a dialog box in which you can choose the desired window. Help About Microplate Manager displays version information about the application.