
Software Updates User guide

CFX96 Touch, CFX96 Touch Deep Well, CFX Connect, and CFX384 Touch Systems Instruction Manual
77
• Apply Fluorescent Drift Correction. For wells that have abnormally drifting RFU values
during the initial few cycles of a run, the software derives an estimated baseline from
adjacent wells for which a horizontal baseline was successfully generated
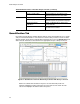
Adjusting the Baseline
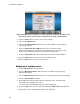
Once wells for analysis have been selected, check the baseline settings in these wells. Open
the Baseline Threshold window (Figure 53) to change the default baseline for selected wells. To
open this window:
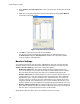
1. Select a single fluorophore in the Quantification tab (Figure 51) by clicking the box next
to the fluorophore name located under the Amplification chart.
2. Select Settings > Baseline Threshold to open the Baseline Threshold window.
To adjust the begin and end baseline cycle for each well:
1. In the Baseline Cycles pane, select one or more wells by clicking the row number,
clicking the top left corner to select all wells, holding down the Control key to select
multiple individual wells, or holding down the shift key to select multiple wells in a row.
2. Adjust the Baseline Begin cycle and Baseline End cycle for all selected wells, or
change the Begin and End cycle number at the bottom of the spreadsheet (Figure 53).
3. To revert the settings back to the last saved values, click Reset All User Defined
Values.
4. Click OK to confirm any changes and close the window.
TIP: To have the same cycle range used to determine the baseline for all of your
data files define this in the Data Analysis tab of the User Preferences window.
This value will be applied to all subsequently created data files.
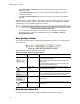
Analysis Mode
Data can be analyzed and displayed grouped by either fluorophore or target name. To choose
the data analysis mode, select Settings > Analysis Mode or make a selection from the
Analysis Mode drop-down menu in the toolbar.
When Fluorophore is chosen, data traces are displayed by fluorophore as indicated in the
plate setup for that run (Figure 54). Individual fluorophore data are displayed in the
amplification and standard curve chart (if available) by checking the appropriate fluorophore
selector checkboxes located below the amplification chart.