
Software Updates User guide


Data Analysis Overview
76
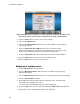
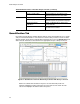
2. Select Settings > Baseline Threshold... in the menu bar to open the Baseline Threshold
window.
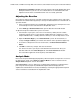
3. Adjust the crossing threshold (Figure 53) for the fluorophore by clicking User Defined
and entering a threshold number.
Figure 53. Baseline Threshold window.
4. Click OK to confirm the change and close the window.
TIP: To have the same threshold value used for all of your data files define this in
the Data Analysis tab of the User Preferences window. This value will be applied
to all subsequently created data files.
Baseline Settings
The software automatically sets the baseline individually for each well. Select the Baseline
Setting to determine the method of baseline subtraction for all fluorescence traces. Select
Settings > Baseline Setting to choose one of these three options:
• No Baseline Subtraction. The software displays the data as relative fluorescence
traces. Some analysis is not possible in this analysis mode and therefore the software
does not display the Gene Expression, End Point, and Allelic Discrimination tabs
• Baseline Subtracted. The software displays the data as baseline subtracted traces for
each fluorophore in a well. The software must baseline subtract the data to determine
quantification cycles, construct standard curves, and determine the concentration of
unknown samples. To generate a baseline subtracted trace, the software fits the best
straight line through the recorded fluorescence of each well during the baseline cycles
and then subtracts the best fit data from the background subtracted data at each cycle
• Baseline Subtracted Curve Fit. The software displays the data as baseline subtracted
traces and the software smoothes the baseline subtracted curve using a centered mean
filter. This process is performed so that each C
q
is left invariant
Along with the latter two options above, the following can also be selected: