
Software Updates User guide


CFX96 Touch, CFX96 Touch Deep Well, CFX Connect, and CFX384 Touch Systems Instruction Manual
75
Step Number Selector
The CFX96 Touch™, CFX96 Touch Deep Well™, CFX Connect™, and CFX384 Touch™
systems can acquire fluorescence data at multiple protocol steps; the software maintains the
data acquired at each step independently. The software displays the Step Number selector
below the Standard Curve chart on the Quantification tab whenever a protocol contains more
than one data collection step. When you select a step, the software applies that selection to all
the data that are shown in the Data Analysis window. Figure 52 shows the data collection step
number is 3 for all the data.
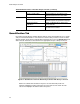
Figure 52. Step Number selection in the Data Analysis window.
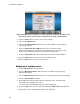
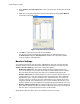
Viewing Well Groups in Data Analysis
Wells in the plate can be grouped into subsets for independent analysis using well groups.
When you create well groups in the Well Groups Manager window (page 56), group names
appear in the Data Analysis window Well Groups drop-down list on the toolbar.
TIP: To edit, create, and delete well groups, click the Manage Well Groups button
in the toolbar.
By default, the well group All Wells is selected when the Data Analysis window is first opened,
showing the data in all wells with content shown in the charts and spreadsheets.
NOTE: If no well groups have been created, the Well Groups drop-down list will not
appear in the toolbar.
Figure 51 shows Group 1 selected in the Well Groups menu. Only the wells in that well group
appear loaded with content in the well selector, and only data for those wells are included in
the data analysis calculations.
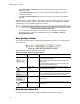
Data Analysis Settings
The Amplification chart data in the Quantification tab show the relative fluorescence (RFU) for
each well at every cycle. Each trace in the chart represents data from a single fluorophore in
one well. These data are used to determine C
q
values for each well on a per fluorophore basis.
The software uses one of two modes to determine C
q
values:
•Regression. This mode applies a multivariable, nonlinear regression model to individual
well traces and then uses this model to compute an optimal C
q
value
• Single Threshold. This mode uses a single threshold value to calculate the C
q
value
based on the threshold crossing point of individual fluorescence traces
Select Settings > Cq Determination Mode to choose the C
q
determination mode.
Adjusting the Threshold
In Single Threshold mode, adjust the threshold for a fluorophore by clicking on the threshold
line in the Amplification chart and moving the mouse pointer vertically. Alternatively, specify an
exact crossing threshold for the selected fluorophore by following these instructions:
1. Select one fluorophore in the fluorophore selector in the Quantification tab (Figure 51) by
clicking the boxes next to the fluorophore name located under the Amplification chart.