
Software Updates User guide


Data Analysis Overview
74
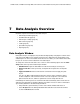
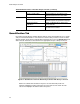
Quantification Tab
Each tab in the Data Analysis window displays data in charts and spreadsheets for a specific
analysis method and includes a well selector to select the data you want to show. The Data
Analysis window opens with the Quantification tab (Figure 51) in front. The Amplification chart
data in this tab should be used to determine the appropriate analysis settings for the run.
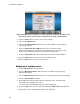
Figure 51. Quantification tab in the Data Analysis window with Group 1 selected.
NOTE: The software links the data in the panes of each Data Analysis tab. For
example, highlighting a well by placing the mouse pointer over the well in the well
selector view highlights the data in all the other panes.
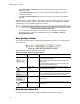
Export to LIMS Folder... Open a window to save data in a pre-
determined format to the LIMS folder
Tools Reports... Open the Report for this data file
Well Group Reports... Open the Well Group Report window to
generate reports for specified well groups
Import Fluorophore
Calibration...
Select a calibration file to apply to the
current data file
qbase+ Launch qbase+ v2.5 directly from current
.pcrd file if it is installed
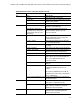
Table 20. Menu bar items in the Data Analysis window. (continued)
Menu Item Command Function