
Software Updates User guide
Gene Expression Analysis
126
location to store the file. Select File > Save As to save the report with a new name or in a
new location.
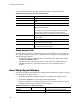
7. Create a report template once you create a report with the content you want to include in
all reports. To create a template, select Te m p l a t e > S a v e or Save As and save the
current report as a template.
Gene Expression Calculations
CFX Manager™ software calculates formulas automatically and displays the resulting
information in the Data Analysis tabs.
Reaction Efficiency
Evidence suggests that using accurate measure of efficiencies for each primer and probe sets
will give you more accurate results when analyzing gene expression data. The default value of
efficiency used in the gene expression calculations is 100%. To evaluate the reaction
efficiency, generate a standard curve using serial dilutions of a representative sample across a
relevant dynamic range and then record the efficiency for subsequent gene expression
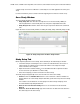
analysis. If your run includes a standard curve, then the software automatically calculates the
efficiency and displays it under the Standard Curve on the Quantification tab when Auto
Efficiency is checked in the Targets tab in the Experiment Settings window.
The efficiency (E) in the efficiency formulas refers to the “efficiencies” as described by Pfaffl
(2001) and Vandesompele et al. (2002). In these publications, an efficiency of 2 (perfect
doubling with every cycle) is equivalent to 100% efficiency in this software. You have the
option to convert your efficiency calculations to those used in the software by using the
following mathematical relationships:
• E = (% Efficiency * 0.01) + 1
• % Efficiency = (E - 1) * 100
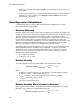
Relative Quantity
The relative quantity (ΔC
q
) for any sample (GOI) is calculated with this formula:
Where:
• E = Efficiency of primer and probe set. This efficiency is calculated with the formula
(% Efficiency * 0.01) + 1, where 100% efficiency = 2
•C
q
(MIN)
= Average C
q
for the Sample with the lowest average C
q
for GOI
•C
q
(sample)
= Average C
q
for the Sample
• GOI = Gene of interest (one target)
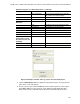
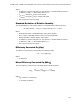
Relative Quantity When a Control Is Selected
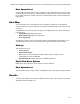
When a control sample (control) is assigned, then the relative quantity (RQ) for any sample
(GOI) with a gene of interest is calculated with this formula:
Relative Quantity
sample (GOI)
E
GOI
(C
q (MIN)
C–
q (sample)
)
=
Relative Quantity
sample (GOI)
E
GOI
C
q (control)
C–
q (sample)
()
=