
Software Updates User guide


CFX96 Touch, CFX96 Touch Deep Well, CFX Connect, and CFX384 Touch Systems Instruction Manual
117
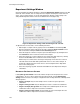
SHOW ANALYSIS SETTINGS IN EXPERIMENT SETTINGS
Click the Show Analysis Settings box in the Experiment Settings window to view or change
analysis parameters applied in the Bar Chart tab:
• Click a cell in the Color column to change the color of the targets graphed in the
Gene Expression chart
• Enter a number for the efficiency of a target. The software will calculate the relative
efficiency for a target using Auto Efficiency if the data for a target include a standard
curve. Alternatively, type a previously determined efficiency
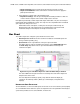
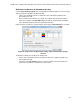
Figure 84 shows the efficiency of all the targets, which appear if Auto Efficiency is selected.
Figure 84. Targets tab in the Experiment Settings window with Analysis Settings
selected.
To adjust the settings for a sample in the Samples tab:
• Click a color in the Color column to change the color of the samples graphed in the
Gene Expression chart
• Click a box in the Show Chart column to show the sample in the Gene Expression
chart using a color that is selected in the Color column