
Software Updates User guide


CFX96 Touch, CFX96 Touch Deep Well, CFX Connect, and CFX384 Touch Systems Instruction Manual
115
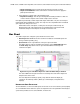
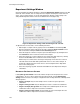
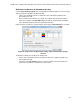
Show Details Option
When Show Details is selected from the right-click menu of the bar chart spreadsheet, the
spreadsheet shows the information listed in Table 39.
Corrected Expression SEM
(or SD)
Corrected value calculation for standard error of the mean
(SEM) or standard deviation (SD) of the relative expression,
depending on the selected option
Mean C
q
Mean of the quantification cycle
C
q
SEM (or SD) Standard error of the mean or standard deviation of the
quantification cycle, depending on the selected option
Table 39. Information in the bar chart spreadsheet with Show Details selected.
Information Description
Data Set Fluorescence data from one fluorophore in the data file
Relative Quantity Calculated relative quantity of samples
Relative Quantity SD Standard deviation of the relative quantity calculation
Corrected Relative Quantity
SD
Calculated standard deviation of the corrected relative
quantity
Relative Quantity SEM Standard error of the mean of the relative quantity calculation
Corrected Relative Quantity
SEM
Calculated standard error of the mean of the corrected relative
quantity
Unscaled Expression Calculated unscaled expression
Unscaled Expression SD Calculated standard deviation of the unscaled expression
Corrected Unscaled
Expression SD
Calculated standard deviation of the unscaled expression
Unscaled Expression SEM Calculated standard error of the mean of the unscaled
expression
Corrected Unscaled
Expression SEM
Calculated standard error of the mean of the unscaled
expression
Expression Relative expression level
Wells Well number in the plate
Table 38. Description of information in the spreadsheet on the Bar Chart tab. (continued)
Information Description