
Software Updates User guide


Gene Expression Analysis
114
• Coefficient of variation (CV) of normalized reference gene relative quantities. A
lower CV value denotes higher stability
• M-value. A measure of the reference gene expression stability
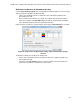
Right-Click Menu Options
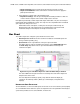
Right-click on the bar chart to select the items shown in Table 37.
Data Spreadsheet
Table 38 describes the information shown in the bar chart spreadsheet.
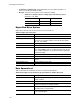
Table 36. Acceptable values for stably expressed reference genes.
(Hellemans et al. 2007)
Samples CV M
Homogeneous <0.25 <0.5
Heterogeneous <0.5 <1
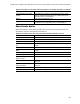
Table 37. Right-click menu items.
Item Function
Copy Copy the chart to a clipboard
Save Image As... Save the chart as an image file. Set the resolution and
dimensions of the image and then select the file type (PNG,
GIF, JPG, TIF, or BMP)
Page Setup... Select a page setup for printing
Print... Print the chart
Set Scale to Default Select Show All to have all of the data visible in the bar chart
frame or Scroll Bar to have a scroll bar appear if there are too
many samples to display in the chart frame while maintaining a
minimum bar width
Chart Options... Open the Chart Options window to adjust the graph
Sort... Sort the order samples or targets appear on the chart x-axis
User Corrected Std Devs Calculate the error bars using the corrected standard deviation
formula
Use Solid Bar Colors Display solid bars in the chart
X Axis Labels Choose to display x-axis labels horizontaly or angled
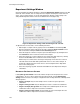
Table 38. Description of information in the spreadsheet on the Bar Chart tab.
Information Description
Target Target Name (amplified gene) selected in the Experiment
Settings window
Sample Sample Name selected in the Experiment Settings window
Ctrl Control sample, when the Sample Name is selected as a
control in the Experiment Settings window
Expression Normalized Gene Expression (ΔΔC
q
) or Relative Quantity (ΔC
q
)
depending on the selected mode
Expression SEM (or SD) Standard error of the mean or standard deviation, depending
on the selected option