
Software Updates User guide

Gene Expression Analysis
112
To set up normalized gene expression (ΔΔC
q
) analysis, follow these steps:
1. Open a data file (.pcrd extension).
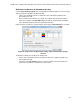
2. Review the data in the Quantification tab of the Data Analysis window. Make
adjustments to the data, such as changing the threshold and the Analysis Mode.
3. Click the Gene Expression tab.
4. Choose a control in the Samples tab of the Experiment Settings window. If a control is
assigned, the software normalizes the relative quantities for all genes to the control
quantity, which is set to 1.
5. Select reference genes for this run in the Targ e t tab of the Experiment Settings window.
Gene expression analysis requires one reference among the targets in your samples.
6. Select Normalized Expression (ΔΔC
q
), if it is not already selected, and then view the
expression levels in the Gene Expression tab.
NOTE: The Setup Wizard (page 48) can also be used to set up the plate layout for
normalized gene expression analysis.
RELATIVE QUANTITY
By definition, relative quantity (ΔC
q
) data are not normalized. This method is used to quantitate
samples that do not include any reference genes (targets). Typically, researchers are confident
in one of the following considerations when they set up their run:
• Each sample represents the same amount of template in each biological sample,
possibly the same mass of RNA or cDNA in each well
• Any variance in the amount of biological sample loaded will be normalized after the
run by some method in the data analysis outside of the software. For example, a
researcher might choose to simply divide the relative quantity value by the
normalizing factor, possibly the mass of nucleic acid loaded for each sample, or the
number of cells from which the nucleic acid was isolated
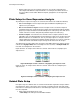
Select Relative Quantity (ΔC
q
) from the drop-down menu in the chart controls of the Gene
Expression tab to run a Relative Quantity (ΔC
q
) analysis.
TIP: To compare results to data from other gene expression runs, open a new Gene
Study (page 124) or add a data file to an existing Gene Study.
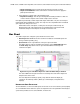
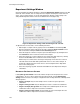
Adjusting Gene Expression Data
After selecting your analysis mode, adjust the data you view in the Gene Expression tab by
changing the settings options to the right of the chart.
GRAPH DATA
Graph data options allow you to present the data in the graph with one of these options:
• Relative to control. Graph the data with the axis scaled from 0 to 1. If you assign a
control in your run, select this option to quickly visualize upregulation and
downregulation of the target
• Relative to zero. Graph the data with the origin at zero
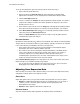
CONTROL SAMPLE
Select the sample that the relative quantities of all targets will be normalized to.