
Software Updates User guide


CFX96 Touch, CFX96 Touch Deep Well, CFX Connect, and CFX384 Touch Systems Instruction Manual
111
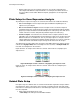
• Replace Plate File. Select a plate layout file that was previously created
• Replace PrimePCR File. Select a PrimePCR
TM
run file from which to apply the
plate layout information
2. Select Reference Targets and Control Sample using
• Experiment Settings. This will open the Experiment Settings window so that one
or more reference targets and a control sample can be selected
If the plate layout already contains target and sample information, only the second step is
required and will be highlighed in orange. This step must be completed before normalized
gene expression analysis can occur.
NOTE: Data for the clustergram, scatter plot, volcano plot, and heat map are
displayed only if all of the requirements for normalized gene expression listed
under Plate Setup for Gene Expression Analysis have been met.
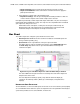
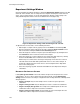
Bar Chart
The relative expression of targets is presented in these two views:
• Gene Expression chart. Shows the real-time PCR data as normalized expression
(ΔΔC
q
) or relative quantity (ΔC
q
)
• Spreadsheet. Shows a spreadsheet of the gene expression data
TIP: Right-click any chart or spreadsheet for options. Select View/Edit Plate from
the Plate Setup drop-down menu to open the Plate Editor and change well
contents in the plate.
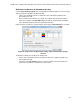
Figure 82. Layout of the Gene Expression tab in the Data Analysis window.
TIP: Select Sort from the right-click menu to rearrange the order of the Target and
Sample names in the chart.
TIP: From Experiment Settings, quickly set up data for bar chart display by
selecting in the following order: 1) Mode, 2) Control Sample, and 3) Reference
target(s).
NORMALIZED GENE EXPRESSION
To normalize data, use the measured expression level of one or more reference genes (targets)
as a normalization factor. Reference genes are targets that are not regulated in the biological
system being studied, such as actin, GAPDH, or Histone H3.