
Software Updates User guide

Data Analysis Windows
106
Well Group Reports
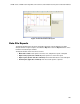
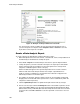
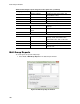
To create reports for specific well groups:
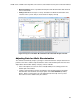
1. Select Tools > Well Group Reports in the data analysis window.
Figure 79. Well Group Reports window.
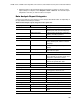
Analysis Settings Includes the melt step number and
threshold bar setting
Melt Curve Chart Copy of the melt curve chart
Melt Peak Chart Copy of the melt peak chart
Data Spreadsheet listing the data in each well
Allelic Discrimination
Analysis Settings Includes fluorophores, cycle, and view
call map
Allelic Discrimination
Chart
Copy of the allelic discrimination chart
Data Spreadsheet listing the data in each well
End Point
Analysis Settings Includes fluorophore, end cycles to
average, mode, lowest RFU value,
highest RFU value, and cut off value
Data Spreadsheet listing the data in each well
QC Parameters
Data Spreadsheet listing the parameters for
each QC rule
Table 35. Data analysis report categories in the options list. (continued)
Category Option Description