
Software Updates User guide

Data Analysis Windows
104
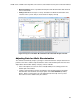
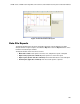
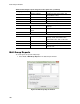
Figure 78. Example of a Report window for a data file.
TIP: The layout of a report can define the type of information that appears in it if
you save the report as a template. Select Te m p l a t e > S a ve or Save As to save the
layout of the current report as a template.
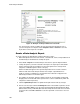
Create a Data Analysis Report
To create a report in the Data Analysis window, follow these steps:
1. Make final adjustments to the well contents, selected wells, charts, and spreadsheets in
the Data Analysis window before creating the report.
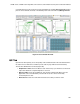
2. Select Tools > Reports in the Data Analysis menu bar to open the Report window.
3. Change the options you want to include in the report. The report opens with default
options selected. Click the checkboxes in the report options list to change whole
categories or individual options within a category.
NOTE: The data that appear in the report are dependent on the current selections
within the tabs of the Data Analysis window. For example, a quantification run
might not contain a standard curve, and therefore those data do not appear in the
Data Analysis window or in the data report.
4. The ordering of categories and items within a report can be changed by clicking and
dragging these to the desired relative position. Items can be reordered only within the
categories to which they belong.
5. Click the Update Report button to update the Report Preview with any changes.
6. Print or save the report. Click the Print Report button in the toolbar to print the current
report. Select File > Save to save the report in PDF (Adobe Acrobat Reader file), MHT
(Microsoft document), or MHTML (Microsoft document) file format and select a location
to store the file. Select File > Save As to save the report with a new name or in a new
location.