
Software Updates User guide

Data Analysis Windows
94
Melt Peaks Spreadsheet
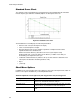
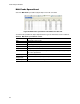
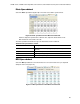
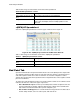
Select the Melt Peaks spreadsheet (Figure 69) to view melt curve data.
Figure 69. Melt Peaks spreadsheet in the Melt Curve Data tab.
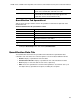
The Melt Peaks spreadsheet (Figure 69) includes the types of information shown in Table 28.
Table 28. Melt Peaks spreadsheet content.
Information Description
Well Well position in the plate
Fluor Fluorophore detected
Content Sample Type listed in the Plate Editor window
Target Amplification target (gene)
Sample Sample Name listed in the Plate Editor window
Melt Temperature The melting temperature of each product, listed as one peak (highest) per
row in the spreadsheet
Peak Height Height of the peak
Begin
Temperature
Temperature at the beginning of the peak
End Temperature Temperature at the end of the peak