
Software Updates Instruction Manual
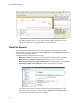


Data Analysis Windows
86
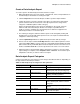
Analysis Settings Includes the step number when data
were collected, the analysis mode, and
the baseline subtraction method
Amplification Chart Copy of the amplification chart for runs
that include quantification data
Standard Curve Chart Copy of the standard curve chart
Data Spreadsheet listing the data in each well
Gene Expression — Bar Chart
Analysis Settings Includes the analysis mode, chart data,
scaling option, and chart error
Chart Copy of the bar chart
Target Names Chart of the names
Sample Names Chart of the names
Data Spreadsheet listing the data in each well
Target Stability Chart of the target stability values
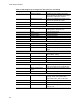
Gene Expression — Clustergram, Scatter Plot, Volcano Plot, Heat Map
Analysis Settings Includes the settings for each chart type
Chart Copy of the chart
Data Spreadsheet listing the data in each
target
Melt Curve
Analysis Settings Includes the melt step number and
threshold bar setting
Melt Curve Chart Copy of the melt curve chart
Melt Peak Chart Copy of the melt peak chart
Data Spreadsheet listing the data in each well
Allelic Discrimination
Analysis Settings Includes display mode, fluorophores,
cycle, thresholds, and normalized data
Allelic Discrimination
Chart
Copy of the allelic discrimination chart
Data Spreadsheet listing the data in each well
End Point
Analysis Settings Includes fluorophore, end cycles to
average, mode, lowest RFU value,
highest RFU value, and cut off value
Data Spreadsheet listing the data in each well
QC Parameters
Data Spreadsheet listing the parameters for
each QC rule
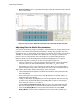
Table 33. Data analysis report categories in the options list. (continued)
Category Option Description