
Software Updates Instruction Manual

Data Analysis Windows
78
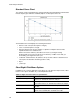
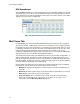
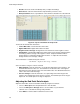
• Results. Shows the results immediately after you adjust the Settings
• Well selector. Select the wells with the end point data you want to show
• Well spreadsheet. Shows a spreadsheet of the end RFU collected in the selected wells
Figure 57. Layout of the End Point analysis tab.
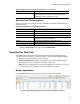
The Results list includes this information:
• Lowest RFU value. Lowest RFU value in the data
• Highest RFU value. Highest RFU value in the data
• Negative Control Average. Average RFU for the wells that contain negative controls
• Cut Off Value. Calculated by adding the tolerance (RFU or Percentage of Range listed in
the Settings) and the average of the negative controls. Samples with RFUs that are
greater than the Cut Off Value will be called “Positive”. To adjust the Cut Off Value,
change the RFU or Percentage of Range
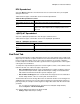
The Cut Off Value is calculated using this formula:
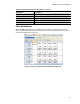
Select a tolerance using one of these methods:
• RFUs (default). Select this method to use an absolute RFU value for the tolerance. The
minimum RFU tolerance value is 2. The maximum is the absolute value of the highest
RFU value minus the absolute value of the lowest RFU value. The default RFU tolerance
value is 10% of the total RFU range
• Percent of Range. Select this method to use a percentage of the RFU range for the
tolerance. The minimum percent of range is 1 percent. The maximum percent of range is
99 percent. The default percent of range is 10 percent
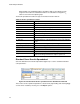
Adjusting the End Point Data Analysis
Adjust the information shown in the End Point tab by using these methods:
• Choose a Fluorophore from the pull-down list to view the data
• Choose an End Cycle to Average value to set the number of cycles that the
software uses to calculate the average end point RFU
• Select RFUs to view the data in relative fluorescence units
Cut Off Value Negative Control Average Tolerance+=