
Software Updates Instruction Manual

Data Analysis Windows
76
Melt Peaks Spreadsheet
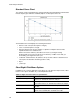
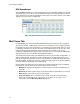
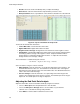
Select the Melt Peaks spreadsheet (Figure 56) to view melt curve data.
Figure 56. Melt Peaks spreadsheet in the Melt Curve Data tab.
The Melt Peaks spreadsheet (Figure 56) includes the type of information shown in Table 27.
Plate Spreadsheet
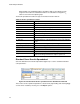
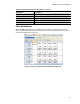
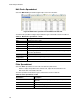
Select the Plate spreadsheet to view melt curve data in a plate format.
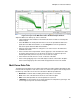
NOTE: To adjust the peak that the software calls, adjust the threshold line in the
Melt Peak chart on the Melt Curve tab.
The Plate spreadsheet includes the types of information shown in Table 28.
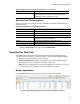
Table 27. Melt Peaks spreadsheet content
Information Description
Well Well position in the plate.
Fluor Fluorophore detected.
Content Sample Type listed in the Plate Editor window.
Target Amplification target (gene).
Sample Sample Name listed in the Plate Editor window.
Melt Temperature The melting temperature of each product, listed as one peak (highest) per
row in the spreadsheet.
Peak Height Height of the peak.
Begin
Temperature
Temperature at the beginning of the peak.
End Temperature Temperature at the end of the peak.
Table 28. Plate spreadsheet content
Information Description
Content A combination of Sample Type (required) and Replicate #
(optional).
Sample Sample description.
Peak 1 First melt peak (highest).
Peak 2 Second (lower) melt peak.