
Software Updates Instruction Manual

Data Analysis Windows
72
NOTE: All Std. Dev (standard deviation) calculations apply to the replicate groups
assigned in the wells in the Plate Editor window. The calculations average the C
q
value for each well in the replicate group.
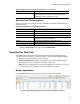
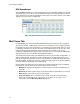
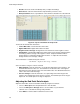
The Results spreadsheet includes the type of information listed in Table 25.
Standard Curve Results Spreadsheet
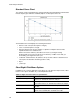
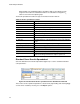
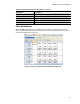
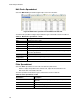
Select the Standard Curve Results Spreadsheet (Figure 52) to see the calculated standard
curve parameters.
Figure 52. Standard Curve Results spreadsheet in the Quantification Data tab
These values can be copied and pasted into a document by right clicking and selecting Copy
or a file can be created by choosing one of the Export options.
Table 25. Results spreadsheet content
Information Description
Well Well position in the plate.
Fluor Fluorophore detected.
Target Amplification target name (gene).
Content Sample type and Replicate number.
Sample Sample description.
Biological Set Name Name of the biological set.
C
q
Quantification cycle.
C
q
Mean Mean of the quantification cycle for the replicate group.
C
q
Std. Dev Standard deviation of the quantification cycle for the replicate
group.
Starting Quantity (SQ) Estimate of the starting quantity of the target.
Log Starting Quantity Log of the starting quantity.
SQ Mean Mean of the starting quantity.
SQ Std. Dev Standard deviation of the starting quantity.
Set Point Temperature of sample in the well for a gradient step.
Sample Note One round of denaturation, annealing, and extension, or one
round of annealing and extension steps in a protocol.