
Software Updates Instruction Manual

MiniOpticon Instruction Manual
61
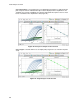
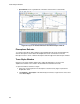
Cycles to Analyze
To restrict data analysis to a specified range of cycles, select Settings > Cycles to Analyze.
Select the starting cycle and the ending cycle using the arrow buttons or by typing in the
desired values and pressing Enter. Click the Restore Defaults button to return to the cycles
originally used for analysis.
NOTE: Removing cycles from the beginning of a run can have a significant impact
on baselining.
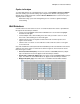
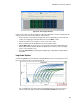
Well Selectors
Click the wells in the well selector to show or to hide the data in the charts or spreadsheets
throughout the Data Analysis window:
• To hide one well, highlight and click the individual well. To show that well, highlight
and click the well again
• To hide multiple wells, click and drag across the wells you want to select. To show
those wells, click and drag across the wells again
• Click the top left corner of the plate to hide all the wells. Click the top left corner
again to show all wells
• Click the start of a column or row to hide those wells. Click the column or row again
to show the wells
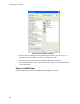
Only wells loaded with content (entered in the Plate Editor) can be selected in the well selector,
and their color shows if they are selected. As shown in Figure 43, the well selector shows
these three types of wells:
• Selected, loaded wells (blue). These wells contain a loaded Unk (unknown) sample
type. The data from these wells appear in the Data Analysis window
• Unselected, loaded wells (light gray). These wells contain loaded Std and Pos sample
types. The data from unselected wells do not appear in the Data Analysis window
• Empty wells (dark gray). These wells were not loaded in the Plate Editor window
Figure 43. Three well colors appear in a well selector.