
Software Updates Instruction Manual


MiniOpticon Instruction Manual
55
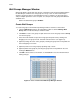
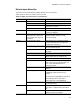
Data Analysis Menu Bar
The menu bar in the Data Analysis window provides these menu items.
Table 19 lists the functions of items in the menu bar.
Table 19. Right-click menu items for spreadsheets.
Menu Item Command Function
File Save Save the file.
Save As Save the file with a new name.
Repeat Run Extract the protocol and plate file from the
current run to rerun it.
Exit Exit the Data Analysis window.
View Run Log Open a Run Log window to view the run
log of those data file.
Quantification, Melt Curve,
Gene Expression, End Point,
Custom Data View, QC, Run
Information
Select the tabs displayed in the Data
Analysis window. At least one tab
must be selected.
Settings Cq Determination Mode Select Regression or Single Threshold
mode to determine how Cq values are
calculated for each trace.
Baseline Setting Select Baseline Subtraction method for
the selected well groups.
Analysis Mode Select to analyze data by Fluorophore or
by Target.
Cycles to Analyze Select the cycles that are to be analyzed.
Baseline Thresholds Open the Baseline Thresholds window to
adjust the baseline or the threshold.
Trace Styles Open the Trace Styles window.
Plate Setup Open the Plate Editor to view and edit the
plate; replace the current plate with one
from a user-defined plate file or a
PrimePCR run file.
Include All Excluded Wells All excluded wells are included in the
analysis.
Mouse Highlighting Turn on or off the simultaneous
highlighting of data with the mouse
pointer.
TIP: If the Mouse Highlighting is turned off,
then hold down the Control key to
temporarily turn on the highlighting.
Restore Default Window Layout Restores the arrangement of windows to
the default setting.
Export Export All Data Sheets to Excel Export all the spreadsheet views from
every tab to a separate Excel formatted
file.
Export RDML File Open a Save As window to specify an
RDML file name and location.