
Software Updates Instruction Manual

MiniOpticon Instruction Manual
111
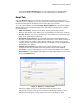
P-Value
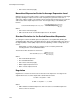
The p-value is a measure of the statistical significance of an experimental sample data point
compared to a control.
NOTE: At least two replicates are required for both control and experimental
samples for a p-value to be determined. The more replicates that are present, the
greater the accuracy.
The p-value is calculated as follows:
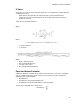
Where:
•
Where:
• = gamma function
• t = t-statistic
Where:
• Mean = Arithmetic mean
• NE = Normalized expression
• Count(x) = Size of list x
• SD = Sample standard deviation
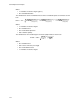
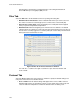
Corrected Values Formulas
A difference between corrected values and noncorrected values is seen only if a standard
curve is created as part of the real-time PCR run. The software uses three equations in
determining the error propagation:
• Standard Error
• Standard Error for Normalized Expression
• Standard Error for the Normalized Gene of Interest (target)
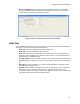
The formula for standard error is shown here:
v Count (NE
sample (Experimental)
Count (NE
sample (Control)
2–+=
Standard Error
SD
n
--------=