
Software Updates Instruction Manual


MiniOpticon Instruction Manual
89
8 Gene Expression Analysis
Read this chapter for information about performing Gene Expression Analysis:
• Gene Expression (page 89)
• Plate setup for gene expression analysis (page 90)
• Guided plate setup (page 90)
• Bar Chart (page 91)
• Clustergram (page 97)
• Scatter Plot (page 98)
• Volcano Plot (page 99)
• Heat Map (page 100)
• Results (page 101)
• Gene Study (page 101)
• Gene Study Report window (page 104)
• Gene expression calculations (page 106)
Gene Expression
With the use of stringently qualified controls in your reactions, you can perform a gene
expression run to normalize the relative differences in a target concentration among samples.
Typically, message levels for one or more reference genes are used to normalize the
expression levels of a gene of interest. Reference genes take into account loading differences
or other variations represented in each sample, and they should not be regulated in the
biological system being studied.
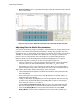
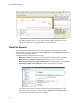
Open the Gene Expression tab (Figure 66) to evaluate relative differences between PCR
reactions in two or more wells. For example, you can evaluate relative numbers of viral
genomes, or relative number of transfected sequences in a PCR reaction. The most common
application for gene expression study is the comparison of cDNA concentration in more than
one reaction to estimate the levels of steady state messenger RNA.
The software calculates the relative expression level of a target with one of these scenarios:
• Relative expression level of a target sequence (Target 1) relative to another target
(Target 2). For example, the amount of one gene relative to another gene under the
same sample treatment