
Manual
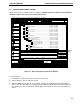
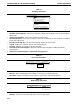

Description of the Compare Icons
Open Run: Opens a highlighted run in the PostRun screen.
Remove Run: Deletes a highlighted method from the compare.
Compare Traces: Opens the Trace Compare window.
Edit Compare: Permits editing of the compare name, description and
author.
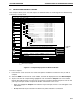
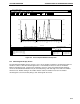
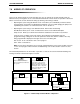
6.5 TRACE COMPARE
Trace Compare is a tool used to simultaneously visualize and compare chromatography data. In Trace
Compare run data can be compared side-by-side in Tiled mode or overlaid on top of each other in Overlay
mode. The Trace Compare screen consists of five functional regions as described in the following Sections
(see Figures 6-8 and 6-9).
Figure 6-8. Trace Compare Window: Tiled View.
100.0% Buffer B
50.0
0.0
[Q] Queue Method #2 Run: [Q] Queue Method #2
Active traces and values at cursor
QuadTec-1 (214 nm) Run: [Q] Queue Method #4 Q
QuadTec-1 (280 nm) Run: [Q] Queue Method #2 [...
QuadTec-2 (260 nm) Run: [Q] Queue Method #2 [...
QuadTec-3 (214 nm) Run: [Q] Queue Method #2 [...
QuadTec-4 (405 nm) Run: [Q] Queue Method #2 [...
Conductivity Run: [Q] Queue Method #2 [Q] Que....
QuadTec-1 (214 nm) Run: [Q] Queue Method #3 Q
Visibility/Trace Color Run
Run: [Q] Queue Meth...
Run: [Q] Queue Meth...
Run: [Q] Queue Meth...
QuadTec-1 (280 nm)
QuadTec-1 (280 nm)
QuadTec-1 (280 nm)
Visibility
Y-Axis
0.400
00:00:00 00:02:00 00:04:00 00:06:00
AUAU
Hr:Min:Sec
0.350
0.300
0.250
0.200
0.150
0.100
0.050
0.000
-0.050
0.080
0.100
0.090
0.070
0.060
0.050
0.040
0.035
0.020
0.010
0.000
-0.010
Fractions
31 3332 34 35 36 37 38 39 40 41 42 43 44
Chromatogram Settings
100.0% Buffer B
50.0
0.0
[Q] Queue Method #4 Run: [Q] Queue Method #4
0.400
00:00:00 00:02:00 00:04:00 00:06:00
AUAU
Hr:Min:Sec
0.350
0.300
0.250
0.200
0.150
0.100
0.050
0.000
-0.050
0.400
0.350
0.300
0.250
0.200
0.150
0.100
0.050
0.000
-0.050
Fractions
1324567891011121314
[Q] Queue Method #3 Run: [Q] Queue Method #3
0.400
00:00:00 00:02:00 00:04:00 00:06:00
AUAU
Hr:Min:Sec
0.350
0.300
0.250
0.200
0.150
0.100
0.050
0.000
-0.050
0.400
0.350
0.300
0.250
0.200
0.150
0.100
0.050
0.000
-0.050
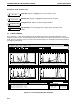
Overlay View
100.0% Buffer B
50.0
0.0
0.400
00:00:00 00:02:00 00:04:00 00:06:00
AUAU
Hr:Min:Sec
0.350
0.300
0.250
0.200
0.150
0.100
0.050
0.000
-0.050
0.080
0.100
0.090
0.070
0.060
0.050
0.040
0.035
0.020
0.010
0.000
-0.010
Fractions
16 1817 19 20 21 22 23 24 25 26 27 28 429
0.0150 AU
0.0015 AU
0.0017 AU
0.0048 AU
1.48 mS/cm
4% Buffer B
00:00:50.8
% Buffer B Run: [Q] Queue Method #2 [Q] Queue...
Run Time
X-Axis
<trace compare name>
File View ToolsOptions
Tiled Run
Window Help
Cascade Overlays Select Colors Full View Report BioLogic Shift DownShift Up
INTRODUCTION TO THE BROWSER SCREEN SYSTEM OPERATION
6-12
Open Run
Remove Run
Compare Traces
Edit Compare