
Software® Upgrades and Conversions Manual


Graphing Function
179
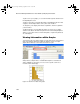
• Analytes across a single sample—In this view a single sample is
represented for each analyte and the selected result (such as FI,
Norm ratio, etc.) used as the y-axis parameter.
Figure 164. Analytes across a single sample view
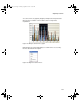
• Analytes across multiple samples—Analytes grouped by sample
along the x-axis and the selected result (such as FI, Norm ratio,
etc.) used as the y-axis parameter.
Figure 165. Analytes across multiple samples view
To choose between plain or 3-dimensional graph bars, choose from the Graph
Type drop-down menu.
BioPlex_6.book Page 179 Friday, September 23, 2011 11:55 AM