
Software® Upgrades and Conversions Manual


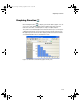

Graphing Function
177
Choosing Graph Options
VIEW
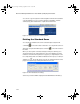
Select the Graph Options button to choose the type of graph that best
displays your Results data. These options are in the View area..
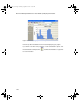
Figure 161. Graph Options dialog
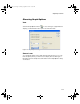
SAMPLE LABEL
You can identify samples of the graph either by their Type (X1, C1, S1) or by
their description (which you enter for each sample). Choose either Type or
Description from the Sample area at the bottom of the Graph Options dialog,
shown above.
BioPlex_6.book Page 177 Friday, September 23, 2011 11:55 AM