
Software® Upgrades and Conversions Manual


Bio-Plex Manager Software 6.1 User Guide | Analyzing the Results
146
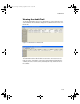
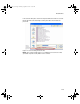
Results Window
The Results window is divided into subwindows, each containing different
options for viewing, formatting, and calculating your data.
Figure 129. Results window
Navigate among the different subwindows using the buttons along the left
side of the Results window:
• Raw Data (see page 150)
• Report Table (see page 153)
• Standard Curve (see page 168)
• Graphing Functions (see page 175)
BioPlex_6.book Page 146 Friday, September 23, 2011 11:55 AM