
Software® Upgrades and Conversions Manual


Histogram and Bead Map
117
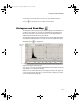
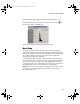
If you are developing your own assay, you may want to plot the Reporter 1
channel against the Doublet Discriminator channel to evaluate the distribution
of the reporter signal. This yields information about the specificity of the
antibodies in the assay.
Figure 105. Changing the channel displayed on the x-axis
SCALING THE BEAD MAP DATA
The default view of the data is log scale. From the toolbar, click the Log/Linear
button to change the display from log to linear. Click again to return to
log scale.
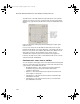
MAGNIFYING AND RESIZING THE BEAD MAP
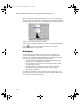
Click the Zoom button in the bead map toolbar to magnify the display.
With Zoom selected, the cursor changes to a hand symbol when you
position it over the map. Drag the hand cursor to view different magnified
regions of the bead map.
Click the Maximize button to maximize the bead map portion of the
window within the larger Protocol window. Click the Restore button to
return the bead map to its default state.
Bead Map Display Options
To access additional Bead Map display settings, right-click the bead map and
select Options.
BioPlex_6.book Page 117 Friday, September 23, 2011 11:55 AM