
Software User guide


Bio-Plex Data Pro Software User Guide | Analysis Workflow
50
Analysis Workflow
The statistical analysis workflow comprises the following actions:
• Choose the variable for comparison. In order to do this, you must
first annotate the data.
• (Optional) Choose the biological replicate group that represents a
control for your experiment (if one exists) to do pair-wise
comparisons between the control and all other groups.
• Select the statistical test to apply to the data.
• Use the filter to exclude data or refine group selection. If the
desired samples are not available in any of the Filter options, add a
new custom column in the Sample table or edit the annotation of
an existing column (Filter).
• For each analyte, visually inspect the differences between the
groups.
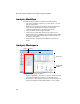
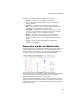
Analysis Workspace
There are three panes in the workspace:
• Analysis configuration — the series of controls on the left most side
of this view that define the specifics of your desired analysis.
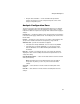
• Analyte table — table at the top of this view. It shows all analytes in
the selected samples with descriptive statistics for each analyte.
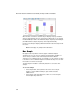
Analysis configuration
Analyte table
Analyte charts
and tables