
Technical data


9 Monitoring a WebLogic Server Domain
9-12 Configuring and Managing WebLogic Server
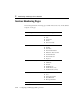
Deployments Monitoring Pages
The following table lists the monitoring pages available in the Deployments Node, and the
attributes displayed on each page
.
Console Page Attributes Displayed
EJB --> Monitoring --> Stateful EJBs ! Cache Access Count
! Cache Hit Count
! Lock Manager Entries Current
Count
! Lock Manager Access Count
! Lock Manager Waiter Total
Count
! Lock Manager Timeout Total
Count
EJB --> Monitoring --> Stateless
EJBs
! Pooled Beans Current Count
! Beans In Use Current Count
! Waiter Current Count
! Pool Timeout Total Count
! Access Total Count
! Miss Total Count
! Pooled Beans Current
EJB --> Monitoring --> Message
Driven EJBs
! Pooled Beans Current Count
! Beans In Use Current Count
! Pool Timeout Total Count
! Access Total Count
! JMSConnection Alive