
Technical data


Monitoring Statistics
117347-A Rev. A 8-5
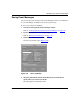
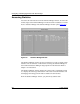
Screen Manager Tool
The Screen Manager tool lets you manage the statistics window database and lets
you define a current screen list. The database contains more than 75 default
statistics windows. In addition, you can design and save up to 4,000 customized
windows. The current screen list is a subset of the entire database of statistics
windows -- usually those you use most often. The list can contain both default and
custom-built windows. You can display only those statistics windows that you
have added to the current screen list.
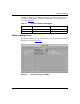
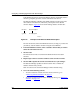
Launch Facility Tool
The Launch Facility tool lets you retrieve and display any statistics windows that
are in the current screen list. When you retrieve statistics from the router, the
Statistics Manager polls the router for all instances of the MIB objects that you
specified in the window, then it formats and displays the data in columns.
There are two modes in which the Statistics Manager retrieves statistics:
• Circuit mode -- The Statistics Manager continually polls the router for
statistics and updates the statistics window with new data. You can specify
how often the Statistics Manager polls the routers for statistics.
• Table mode -- The Statistics Manager retrieves statistics from the router only
once -- when you display the window. You must refresh the window each time
you want to update it with new data.
Circuit mode is predetermined for the default statistics windows. If you build
custom statistics windows, you can specify the mode in which statistics are
retrieved.
Using Online Help
Site Manager provides online Help for each Statistics Manager tool. To get Help,
click on Help at the bottom of the tool’s window. To exit the Help window, click
on OK.