
Technical data


Monitoring Trap and Event Messages
117347-A Rev. A 7-17
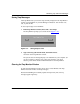
Viewing Messages in the Trap Monitor Window
The Trap Monitor menu bar contains the following options:
File -- Lets you exit the tool.
View -- Lets you view only a subset of the trap messages by type or IP address.
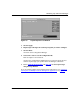
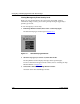
You view trap messages in real time using the Trap Monitor (refer to Figure
7-10).
T
able 7-4 describes the window contents.
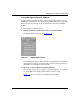
Viewing Specific Trap Messages
After you load the trap messages, you can filter the trap messages you view in the
Trap Monitor window.
Remember that filtering the messages has no effect on which trap messages the
SNMP agent sends to the Site Manager workstation. To specify the types of
messages sent by the SNMP agent, refer to “Selecting
Trap Messages” on
page
7-7.
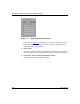
Using the Trap Monitor, you can filter trap messages by trap type (which is the
same as the event severity level) or by IP address.
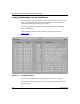
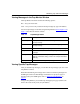
Table 7-4. Trap Message Details
Column Description
Timestamp Displays the date and time the Site Manager workstation received
the trap message
Node Lists the IP address of the router whose SNMP agent generated
the trap message
Slot Lists the slot hosting the entity that generated the trap message
Entity Lists the abbreviated name of the entity that generated the trap
message
Severity Lists the first letter of the trap messages’ severity level: Fault,
Warning, Information, Debug, or Trace. For example, W stands for
Warning.
Description Includes text describing the trap message