
User Manual

en_BA_U500_UR18_Gen2_IO-Link.docx 39/43 Baumer Electric AG
04.04.2019/ Frauenfeld, Switzerland
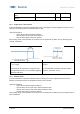
6.6 Histogram
Several diagnosis and process values are continuously tracked to allow predictive maintenance or trouble
shooting tasks. Instead of storing each value by itself, the values are stored in a histogram. Therefore the
range of possible values is divided into several intervals (bins), then the number of occasions are counted that
a new value falls into a interval (bin). This allows to store the values in a much more efficient way and ready
for analysation.
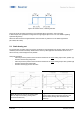
Example based on Device Temperature:
- Range: -40 … +120°C
- Number of Bins: 16 Bin
- Size of a Bin: 160°C / 16 = 10 °C
- Range of Bin 1: -40 …. -30.00 °C
- Range of Bin 2: -20.00 … -10.00 °C
- …
- Range of Bin 16: +110.00 °C ... +120 °C
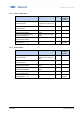
By extracting the related bins and information via IO-Link, it is possible to plot a histogram to get easily the
distribution of the values illustrated.
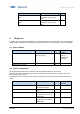
Such histograms are available for
- Device Temperature, Lifetime
- Power Supply Voltage, Lifetime
- Process Value 1: Distance, Resetable
Regarding Device Temperature and Power Supply Voltage, every 10 seconds a measurement is tracked.
For the process values, every single measurement is tracked.
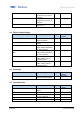
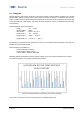
Figure 33: Histogram Device Temperature over Lifetime, Example
The counts of each bin are stored as 32 bit value (up to 4’294’967’296 counts).
8
25
47
35
68
88
102
75
68
92
121
44
79
101
25
55
1 2 3 4 5 6 7 8 9 10 11 12 13 14 15 16
COUNTS
BINS
HISTOGRAM DEVICE TEMPERATURE
OVER LIFETIME